Set the filters
Customize the data displayed on the OSS Coverage dashboard by applying filters to focus on the most relevant projects and ecosystems. These are global filters and apply to all widgets on this dashboard.- Projects: Filter coverage metrics to one or more specific projects.
- Project Tags: Filter by tags applied to your projects.
- Ecosystems: Filter by package ecosystem, for example, Maven, npm, or PyPI.
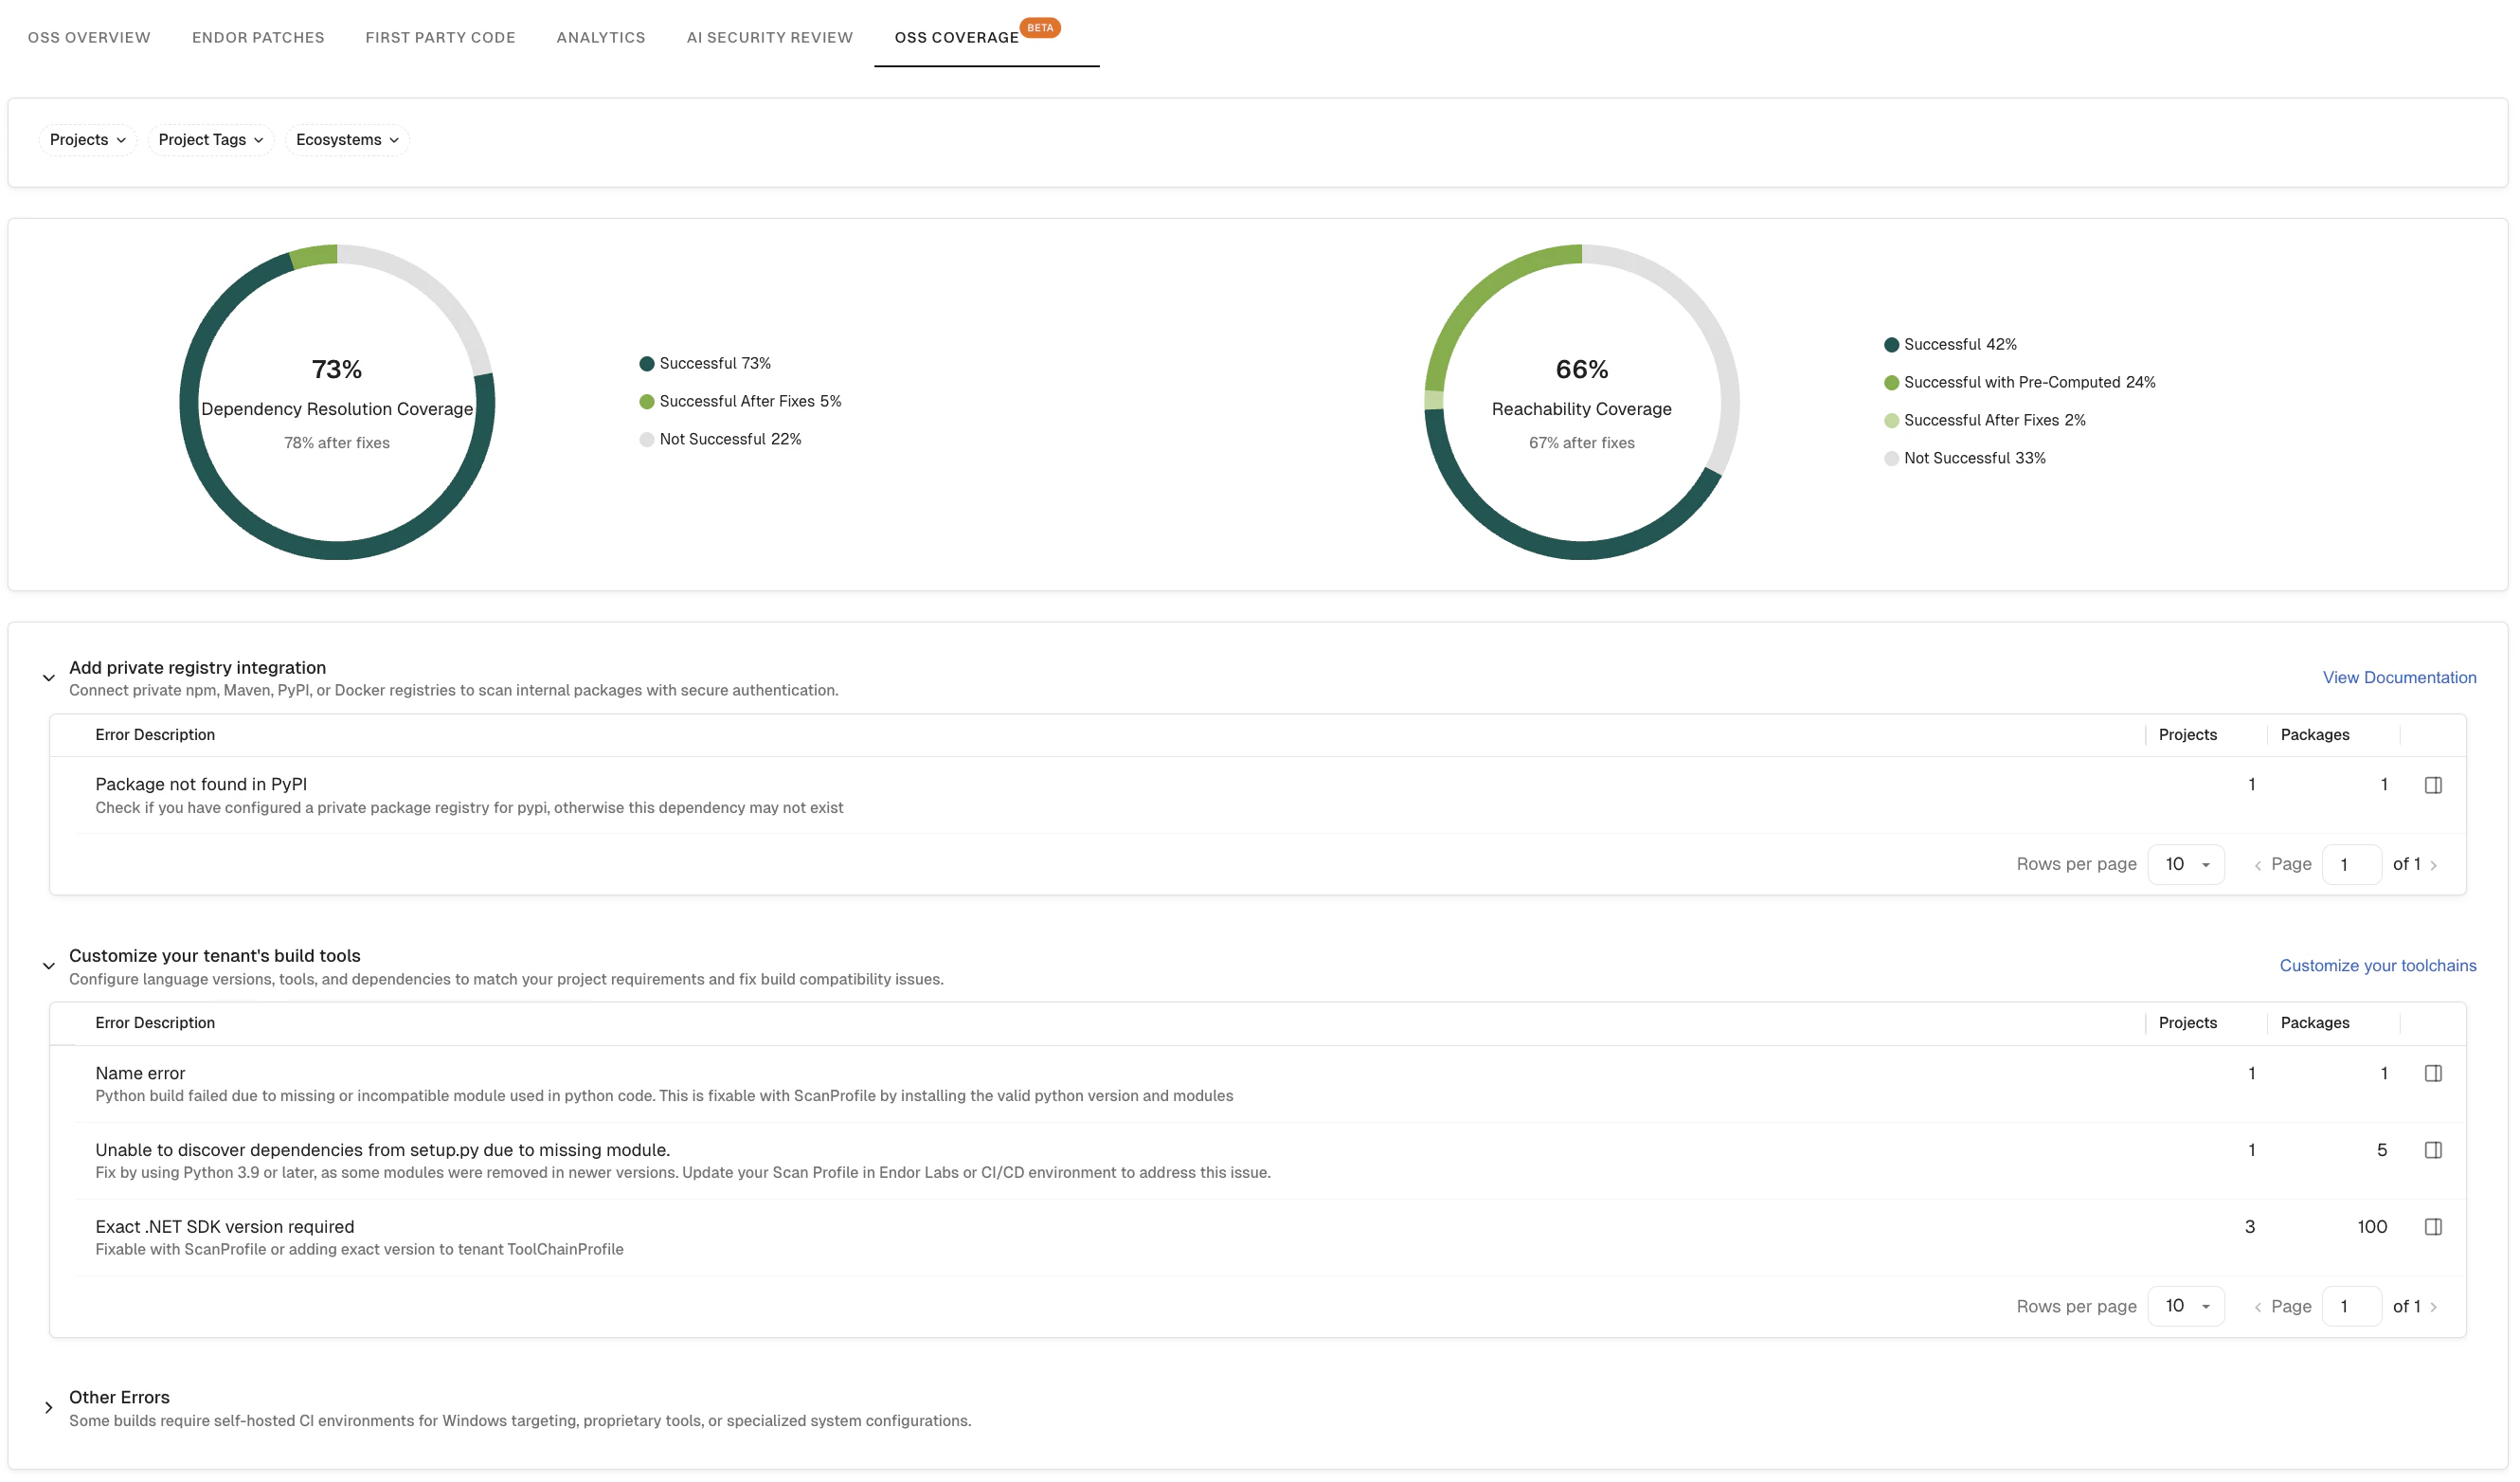
Dependency Resolution Coverage
The Dependency Resolution Coverage widget shows the percentage of scanned projects for which Endor Labs successfully resolved the full dependency graph. Dependency resolution is a prerequisite for accurate vulnerability detection. Projects where resolution fails may have incomplete findings. The widget displays the following categories:- Successful: Projects where dependency resolution completed without errors.
- Successful After Fixes: Projects where dependency resolution succeeded after automated remediation steps were applied.
- Not Successful: Projects where dependency resolution failed. These projects are candidates for investigation. See Add private registry integration for common causes and fixes.
Reachability Coverage
The Reachability Coverage widget shows the percentage of scanned projects for which Endor Labs was able to perform reachability analysis — determining which vulnerabilities in your dependencies are actually reachable from your application code. Higher reachability coverage means Endor Labs can more accurately prioritize exploitable vulnerabilities, reducing false positives. The widget displays the following categories:- Successful: Projects where full reachability analysis was completed using a first-party analysis of your code.
- Successful with Pre-Computed: Projects where reachability was determined using pre-computed call graph data from the Endor Labs database, rather than a direct analysis of your code.
- Successful After Fixes: Projects where reachability analysis succeeded after automated fixes were applied.
- Not Successful: Projects where reachability analysis could not be completed.
Coverage error buckets
When dependency resolution or reachability analysis is not fully successful, the dashboard groups the underlying errors into three expandable buckets. Each bucket includes an Error Description table listing the specific errors encountered, along with the number of Projects and Packages affected. Click any row to open a detail drawer with the full scan log for that error.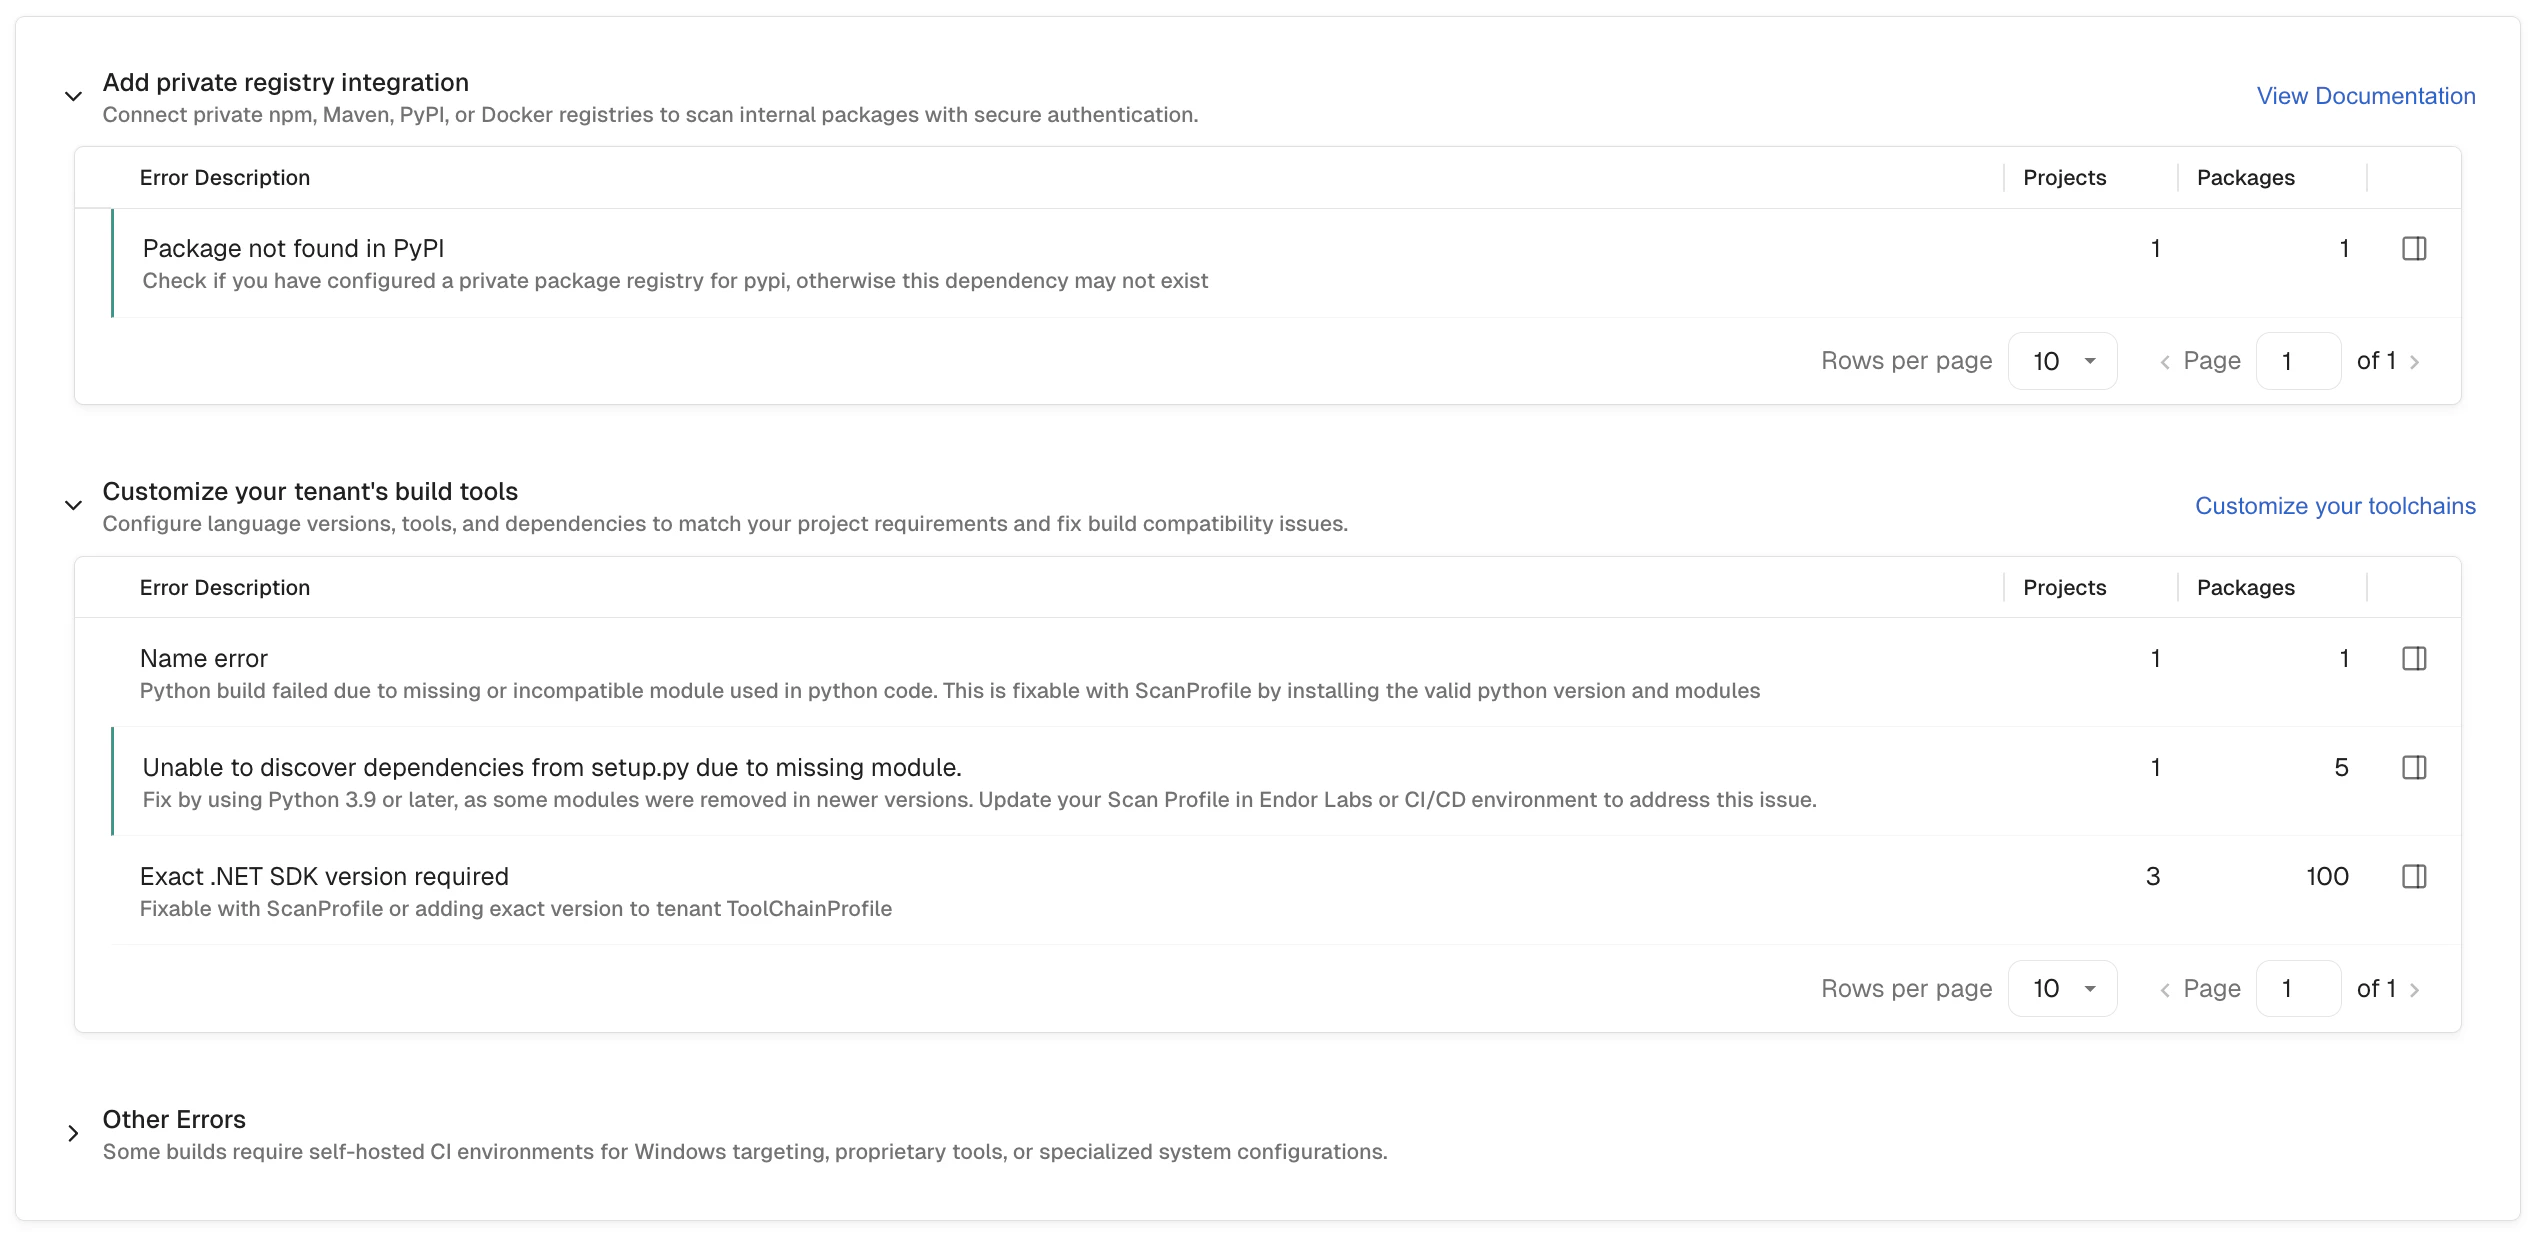
Add private registry integration
The Add private registry integration bucket lists errors caused by dependencies that Endor Labs could not locate in a public registry. This typically occurs when a project depends on packages hosted in a private npm, Maven, PyPI, or Docker registry that Endor Labs does not yet have access to. Example error: Package not found in PyPI — Check if you have configured a private package registry for PyPI, otherwise this dependency may not exist. To resolve these errors, connect your private registry so that Endor Labs can authenticate and fetch internal packages during scanning.Customize your tenant’s build tools
The Customize your tenant’s build tools bucket lists errors caused by build environment mismatches — for example, an incompatible language version, missing build tool, or dependency conflict that prevents Endor Labs from resolving the project’s dependency graph. These errors typically occur when a project requires a specific runtime or toolchain configuration that differs from the Endor Labs default scanning environment. To resolve these errors, configure language versions, tools, and dependencies to match your project’s requirements. Click Customize your toolchains in the dashboard to update your tenant’s build tool settings, or see Build tools.Other Errors
The Other Errors bucket lists errors that are not addressable through registry configuration or toolchain customization. These typically occur when a project requires a self-hosted CI environment, targets Windows-specific dependencies, relies on proprietary tooling, or uses specialized system configurations that are not supported in the Endor Labs scanning environment. These errors may require changes to how the project is scanned, such as runningendorctl directly in your own CI pipeline where the required environment is available. See CI/CD Integration for more information.
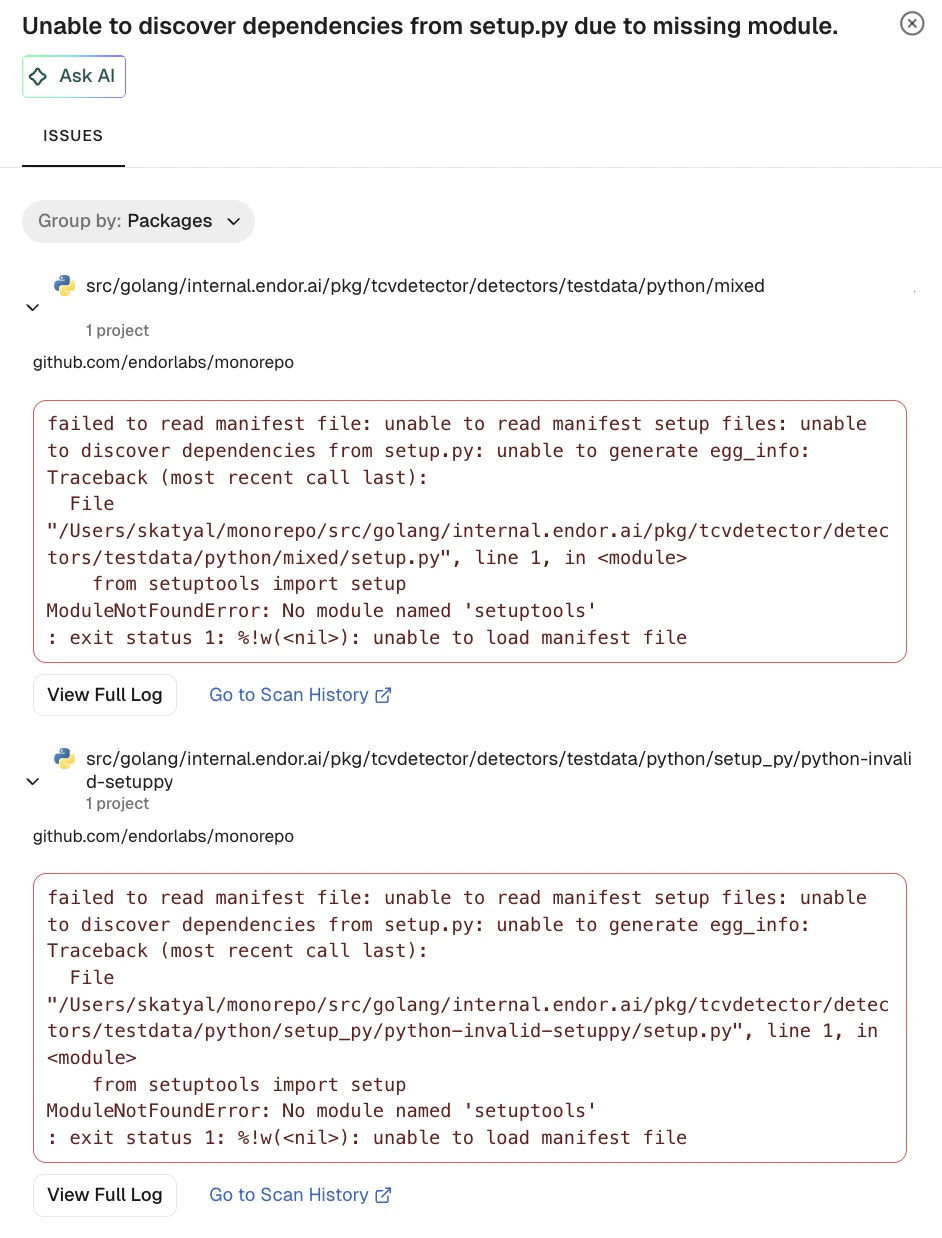
View the full scan log
Each row in the error tables links to a detail drawer that shows the full scan log for that error. You can view details such as:- The affected project name and branch.
- A link to the project repository.
- The full error log output from the scan, showing the exact failure message returned during dependency resolution.
- View Full Log: Opens the complete, untruncated scan log for deeper investigation.
- Go to Scan History: Opens the scan history page for the affected project so you can review previous scan runs and track when the error was first introduced.