

- Select Projects from the left sidebar.
- Search for and select a project to review.
-
Select Scan history to review the past scans.
- Scan status: The status of the scan. The following statuses are possible:
- List of Scans: View all past scans, including details such as the scan time, duration, scan type, and tags.
- Findings Summary: Review the number of security findings, categorized by severity: Critical, High, Medium, or Low.
- Commit Details: Each scan is linked to a specific commit SHA, allowing users to track security issues to specific code changes.
- Scanned By: Identifies the user or system that initiated the scan.
-
Filtering & Search: You can filter scans by status, scan type, and time range. You can search by tags, commit SHA, or specific include or exclude file paths.
For example, you can select Container as a scan type from the dropdown list.
 Scan types like analytics, analytics-check, and finding-refresh are automated and system-triggered. They appear in scan history but do not require any user action. See Scan types for more information.
-
Select a record to view general information about the scan or its logs.
- Overview: View general information about the scan, including the scan status, result UUID, detected programming languages, system details, and the versions of key development tools used in the environment.
-
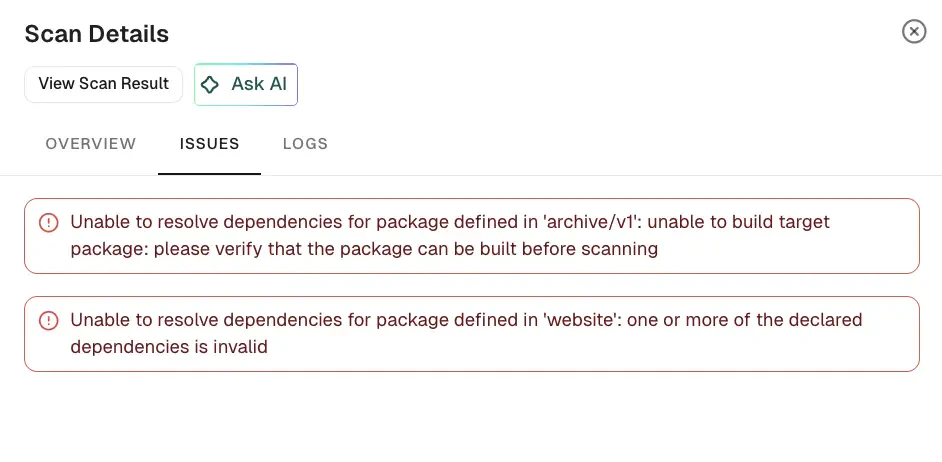
Issues: View additional errors and warnings from the scan. This section appears only when the scan reports errors or warnings.
-
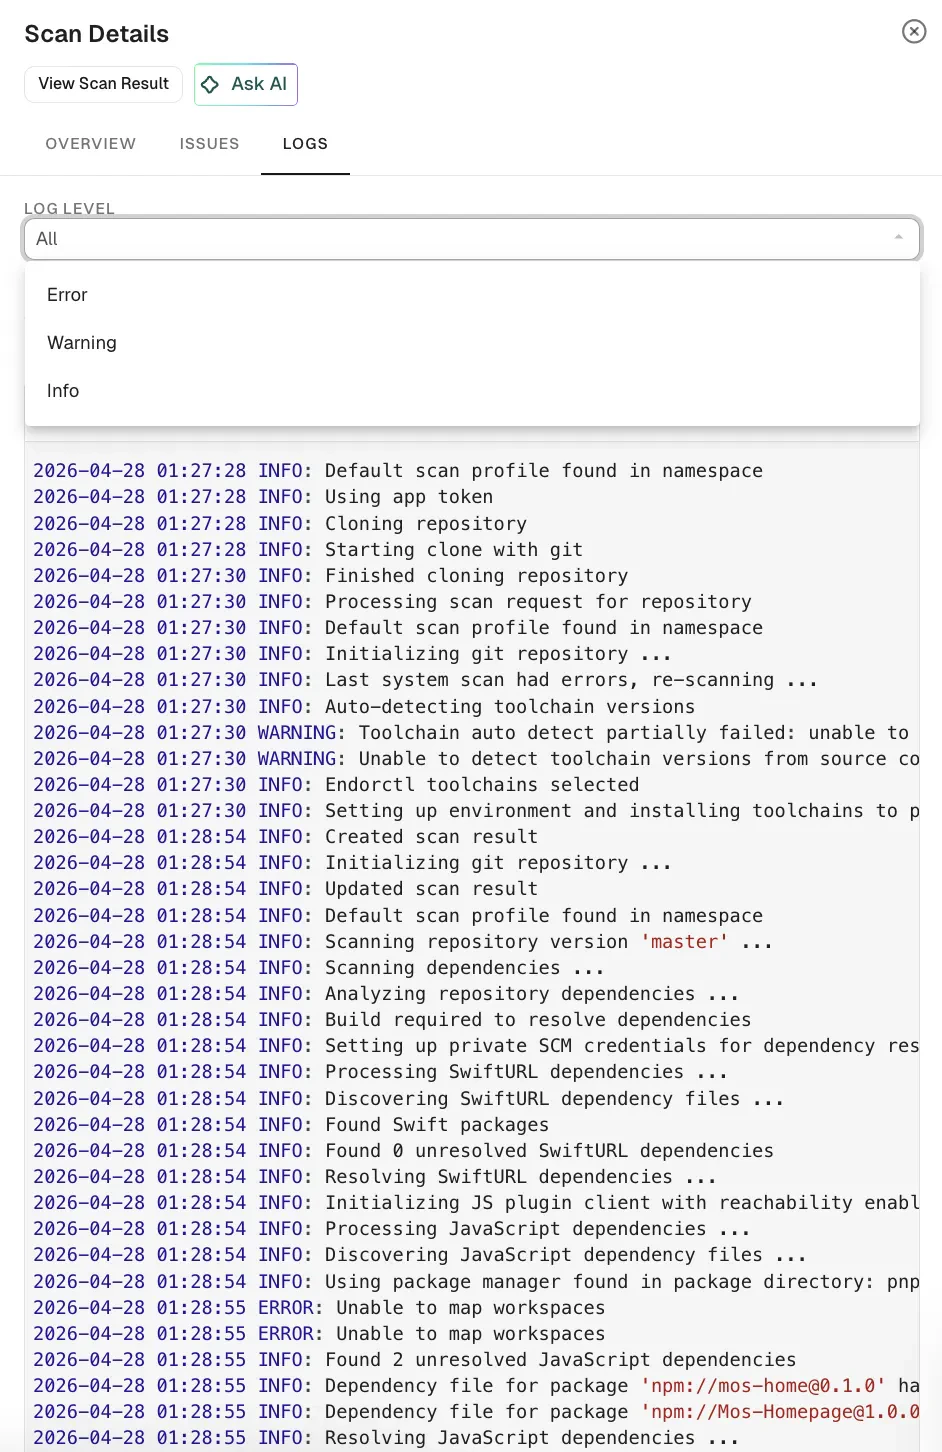
Logs: Monitor scan logs, even while scans are running, and filter by severity level, with selectable log severity from Emergency, Alert, Critical, Error, Warning, Notice, Info, or Debug for in-depth debugging and policy evaluations.
You can access scan logs and toolchain details for projects onboarded through Endor Labs cloud using the GitHub, GitLab, or Azure DevOps Apps. The log levels in the selected scan result determine the available log severities.
For SAST and secret findings, logs include the file path and line numbers where the issue was detected.
-
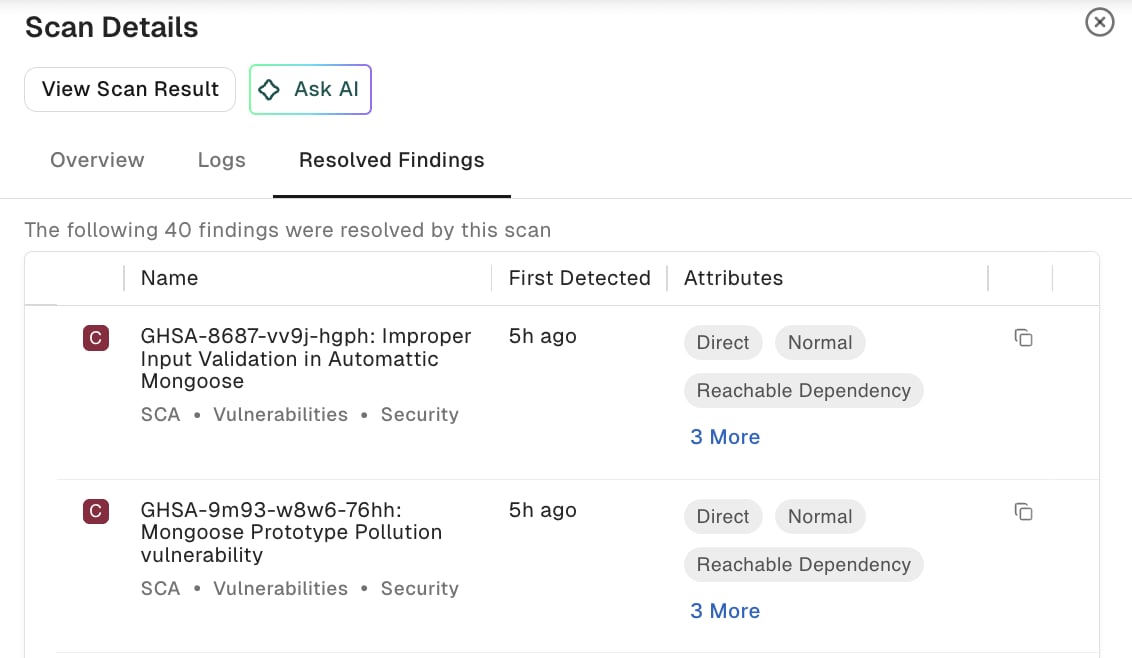
Resolved Findings: View findings that are resolved in a particular scan. This section appears only when the scan resolves one or more findings.
Each entry shows the finding name, severity, category, first detected time, and attribute tags. You can also copy the finding UUID.
Scan history
View the history of scans performed on a project.
Scan history provides a detailed overview of past security scans performed on a project. It helps you understand your project’s security posture over time. With full context and details about individual scans in their repositories, you can assess scan fidelity and troubleshoot issues.
Was this page helpful?