

Open the overview
Select Agent Governance from the left sidebar. The overview opens by default. Use Time Range at the top to scope every metric and chart to a window, such as the last hour, day, week, or a custom range.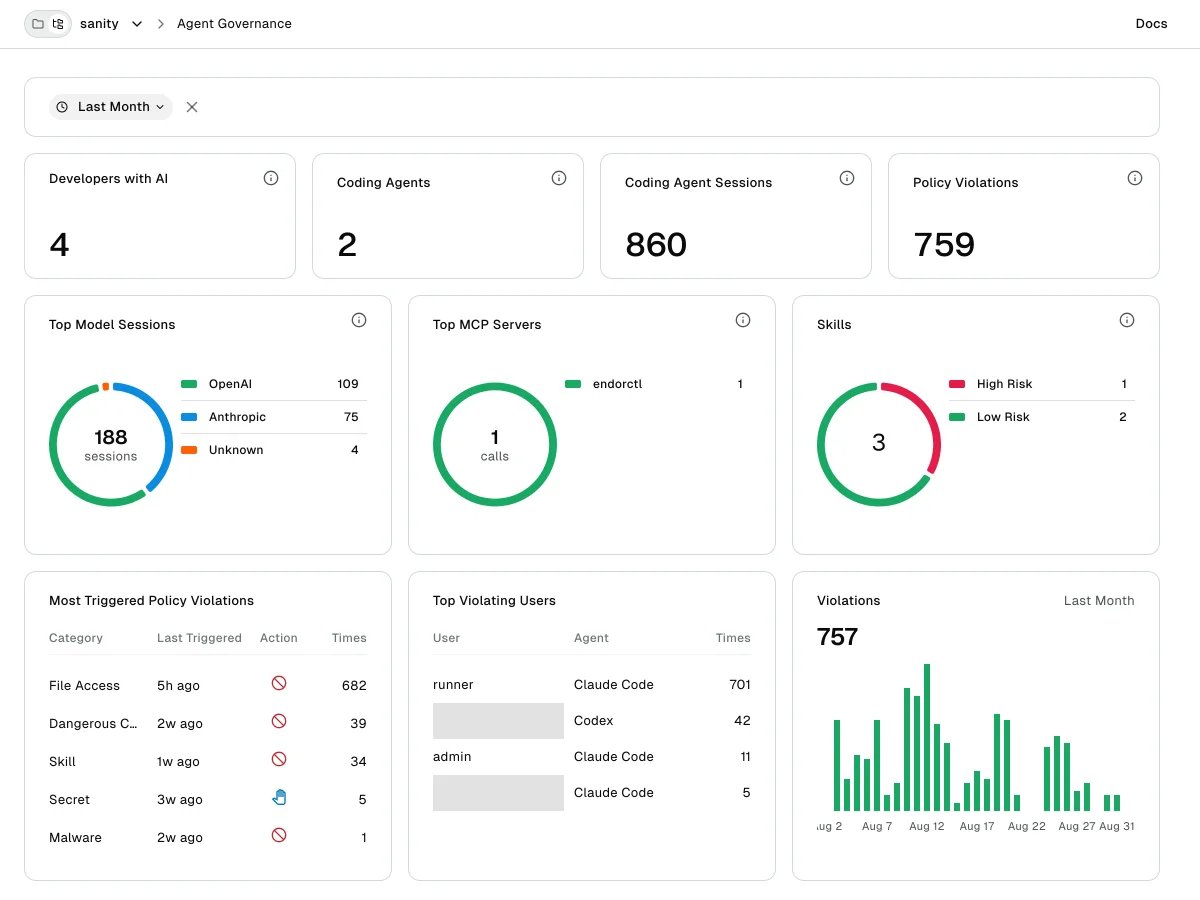
Top metrics
Four counts summarize fleet-wide activity. Hover any metric to see its definition.Composition charts
Three pie charts show what your fleet is using during the selected time range.- Top Model Sessions: The top three models by session count.
- Top MCP Servers: The top three MCP servers by tool-call count.
- Skills: Loaded skills bucketed as Unauthorized, Suspicious, Approved, or Unscored by their Endor Score.
Top violation widgets
Below the pies, two card tables surface the busiest policy violations in the selected time range. Each card shows a few rows and links to Policy Violations with the matching filter applied.- Most Triggered Policy Violations: Top policy match categories by violation count, with the agent and the action taken.
- Top Violating Users: The developers behind the most violations, with the agent they used.
When the overview is empty
The overview shows No data available when nothing matches the current time range. Confirm:- Time Range is wide enough to include relevant events.
- Hooks are deployed and reporting. See Review your agent inventory to confirm activity is arriving.
Next steps
Continue with the following pages:- See Triage policy violations to drill into the events behind the counts.
- See Review your agent inventory to dig into the agents, MCP servers, models, and skills behind the charts.