

Open Policy Violations
Select Agent Governance from the left sidebar, then select Policy Violations. The page opens with three summaries above a per-event table. Use Time Range at the top to scope every summary and the table to the same window.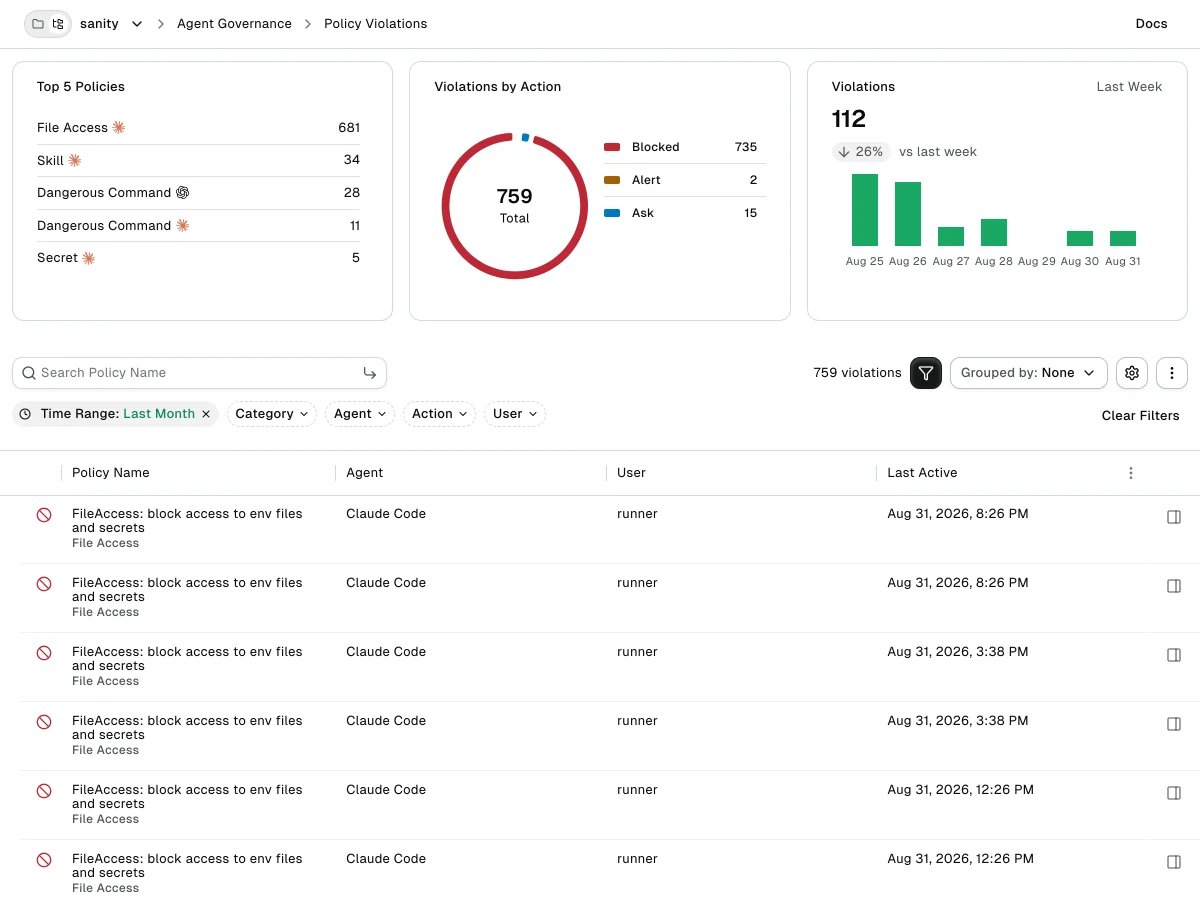
Summary at a glance
Above the violation table, the page shows three summaries:- Top 5 Policies: A ranked breakdown of the busiest match-category and agent combinations.
- Violations by Action: A breakdown of how violations resolved, with the total in the center.
- Violations: The last seven days as a per-day breakdown, with a comparison against the week before.
Top 5 Policies ranks match-category and agent combinations, not individual policy names. Read the table to find specific policies.
Filter results
Use the filters above the table to narrow the rows.- Time Range scopes to the last hour, day, week, or a custom window.
- Category scopes to a single activity type: Dangerous Command, File Access, MCP Tool Call, MCP Server, Skill, Session, Malware, or Secret.
- Agent scopes to one agent: Cursor, Claude Code, Codex, or GitHub Copilot.
- Action scopes to how the violation resolved: Blocked, Alert, or Ask.
- User scopes to one developer.
- Grouped by collapses the table into one row per Category, Agent, User, or Action, with a violation count for each group. Select None to return to the flat list.
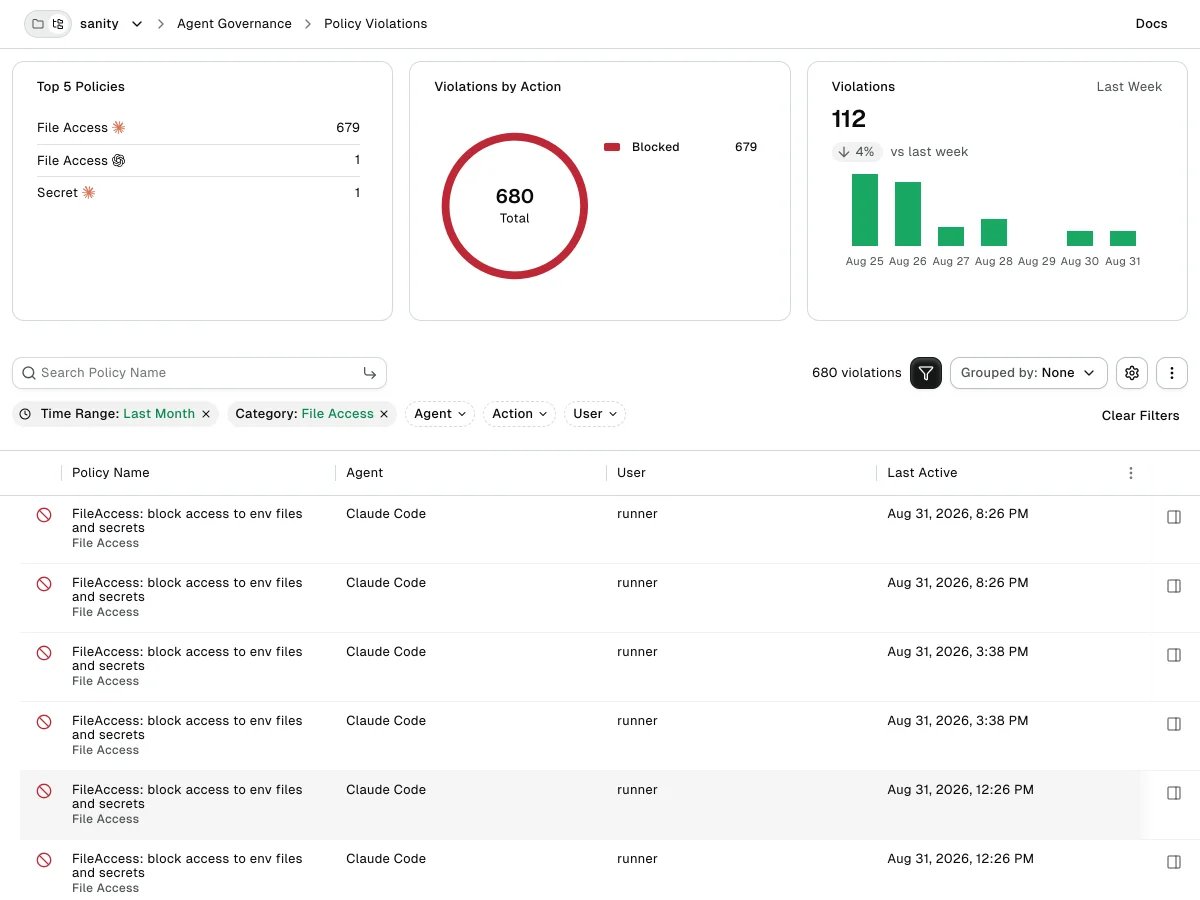
Read a violation
Each row begins with an icon for the action the policy applied. Hover the icon to see whether the action was Blocked, Alert, or Ask. The following table describes the rest of the columns. Select a row to open the violation’s detail drawer. The header shows Action, Policies Matched, and When cards. Below the header, the drawer shows the event context, including the agent, the model, and the session’s permission mode. A Policy Matches section follows. Each match names the policy and carries the matched value and the pattern or criteria that caught it. A secrets match shows the rule and the finding’s line and column instead of the secret value. A malware match shows the package and ecosystem.Common triage workflows
Confirm a new policy is working
After you create a policy, ask one developer to perform an action that matches the policy. Set Time Range to the last hour and Agent to that developer’s agent. Confirm the violation appears with the expected Blocked, Alert, or Ask action.Investigate a single incident
Set Time Range to the suspected window. Browse the rows for the developer’s agent and user. Select the row to open the detail drawer and read the full command, file path, or MCP tool name under Policy Matches.Spot patterns to write new policies
Filter on Category to find clusters of unsanctioned activity. For example, repeated MCP Tool Call rows from the same MCP server are a signal to add an MCP Server Access policy. A wide spread of Dangerous Command rows like the one below points to a missing Command Execution policy.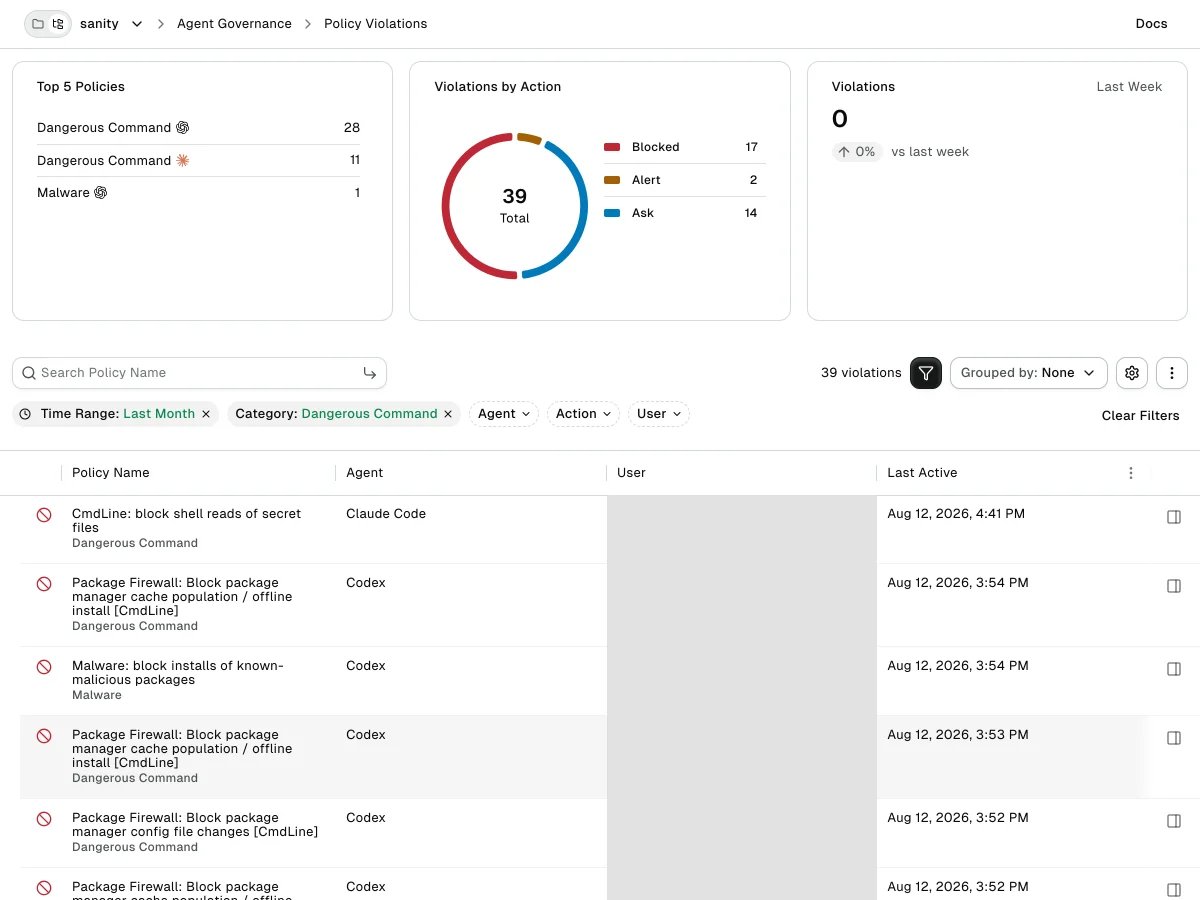
Export violations
The following steps enable you to export the events behind the current view as a CSV report.- Select Export Usage above the table.
- In the Create Report dialog, review the Time Range and the filters. The range defaults to the window the page is scoped to, and the dialog carries your current filters.
- Click Create Report to queue the export.
- Download the file from Reports in the left sidebar. It appears under the Agent Governance report type.
When no violations match
Policy Violations shows No Policy Violations found when nothing matched the current filters. If you expected matches to appear, work through the following checks:- Widen Time Range in case the filter window is too narrow.
- Check hook health on the developer machines you expect to govern. See Deploy hooks for Cursor or Deploy hooks for Claude Code.
- Confirm a policy exists for the activity you expected to match. See Write a policy to create one.
Next steps
Continue with the following pages:- See Read the Coding Agent Governance overview for how violations trend across your fleet.
- See Write a policy to add or refine patterns based on what you find.