

Open the inventory
Select Agent Governance from the left sidebar, then select Inventory. The page opens on the Workstation Inventory tab. Switch tabs to choose what you want to review:- Workstation Inventory to see installed agents and their activity.
- MCP Servers to see the MCP servers your agents call.
- AI Models to see the underlying models invoked through agents.
- Skills to see the skills your agents loaded during sessions.
Workstation Inventory
The Workstation Inventory tab shows every agent and AI tool your hooks have observed. The Developers with Coding Agents pie chart breaks down the agents your developers use. The Sessions trend compares this week’s sessions against last week’s.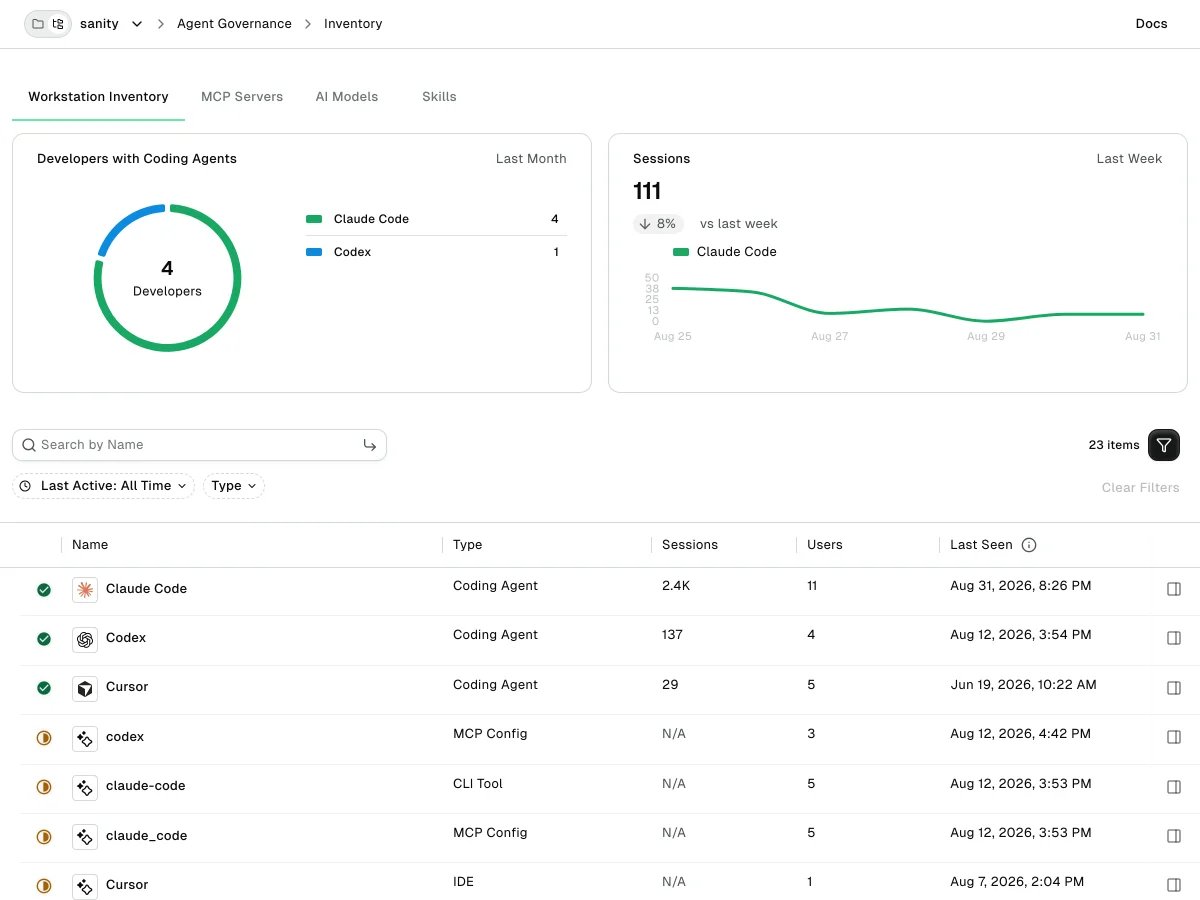
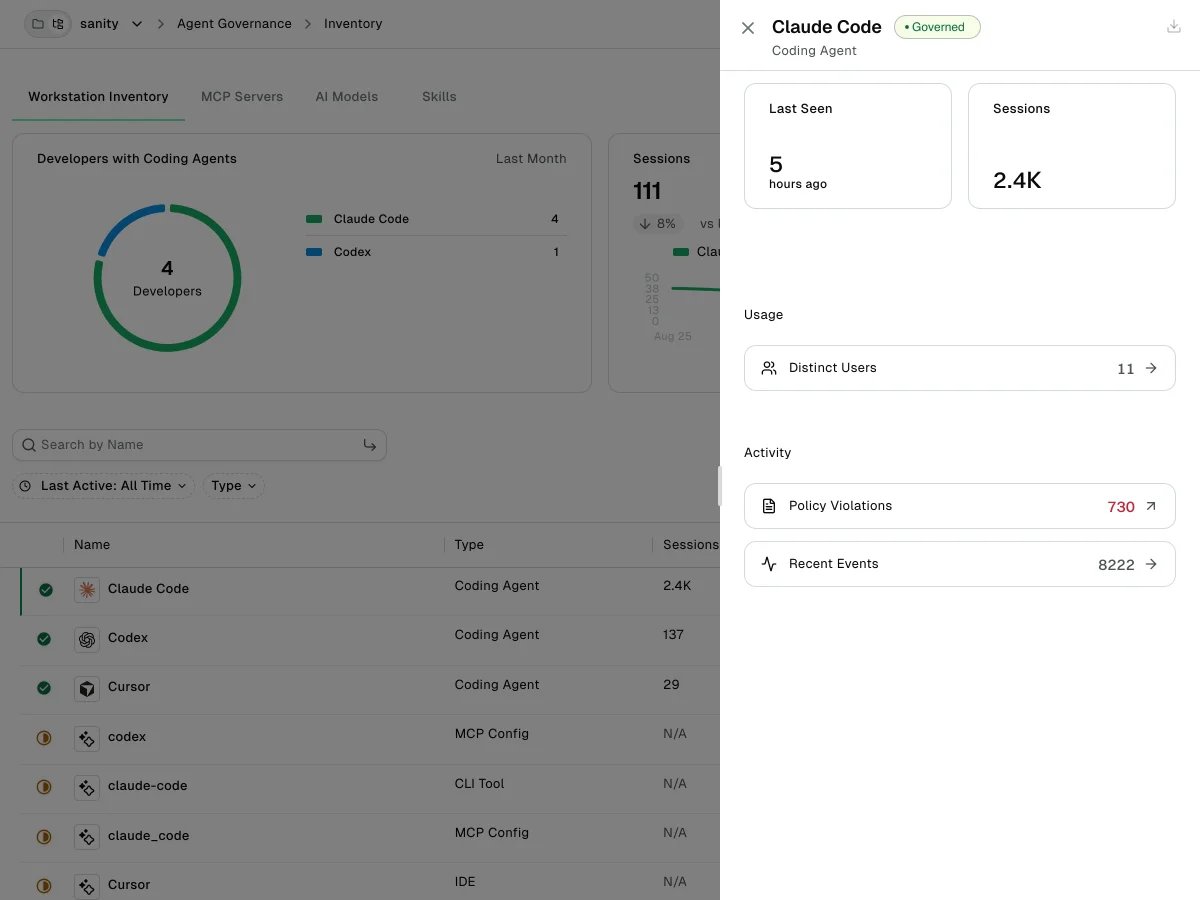
- Last Seen and Sessions cards, with the reported version when the agent sends one.
- A Usage section. Select Distinct Users to open the users panel.
- An Activity section. Select Recent Events to open the event list in a side panel, or Policy Violations to jump to that agent’s violations.
MCP Servers
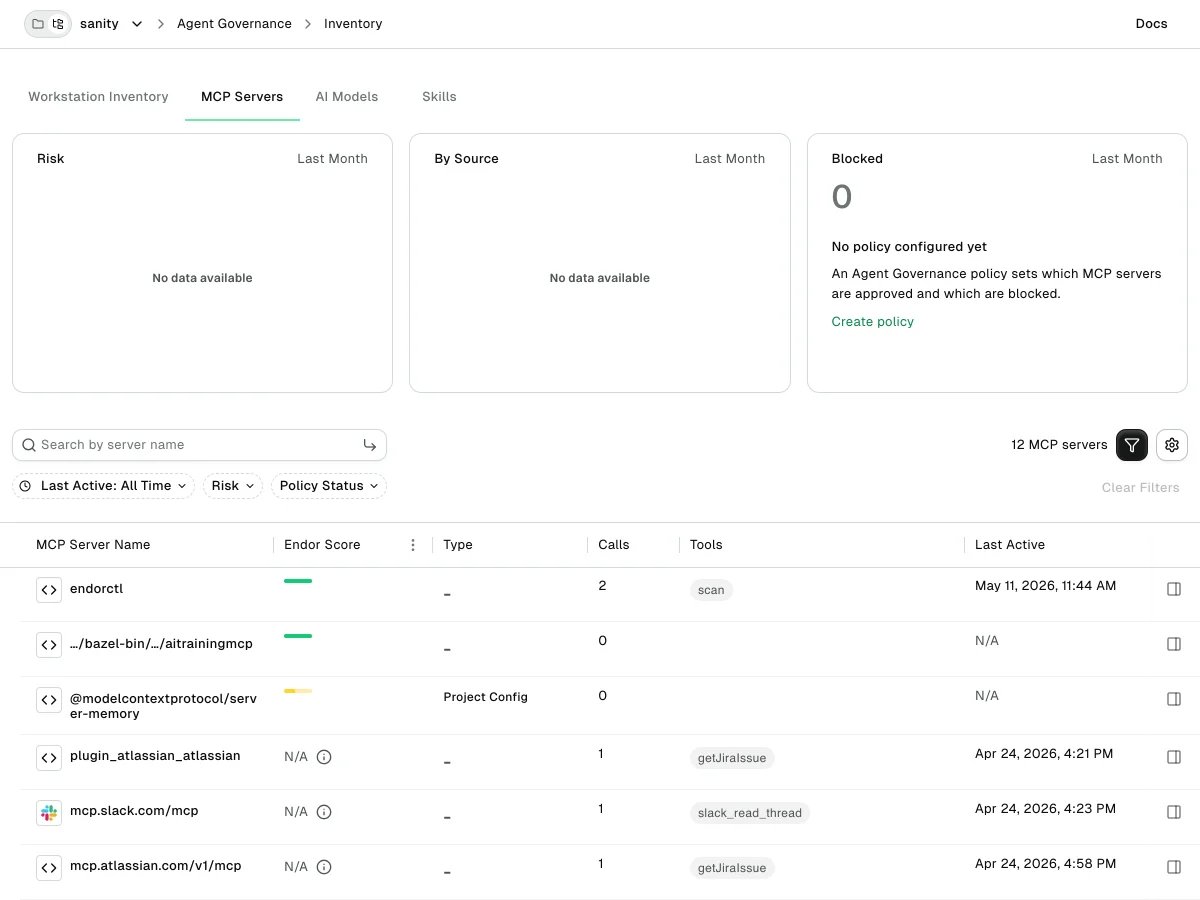
The MCP Servers tab shows every MCP server your agents have called. The following cards summarize the MCP servers your agents called in the last month:- Risk: A donut chart that buckets servers by the risk band derived from their Endor Score.
- By Source: A pie chart that breaks servers down by where they come from.
- Blocked: The count of servers your policies block.
Identify unsanctioned MCP servers
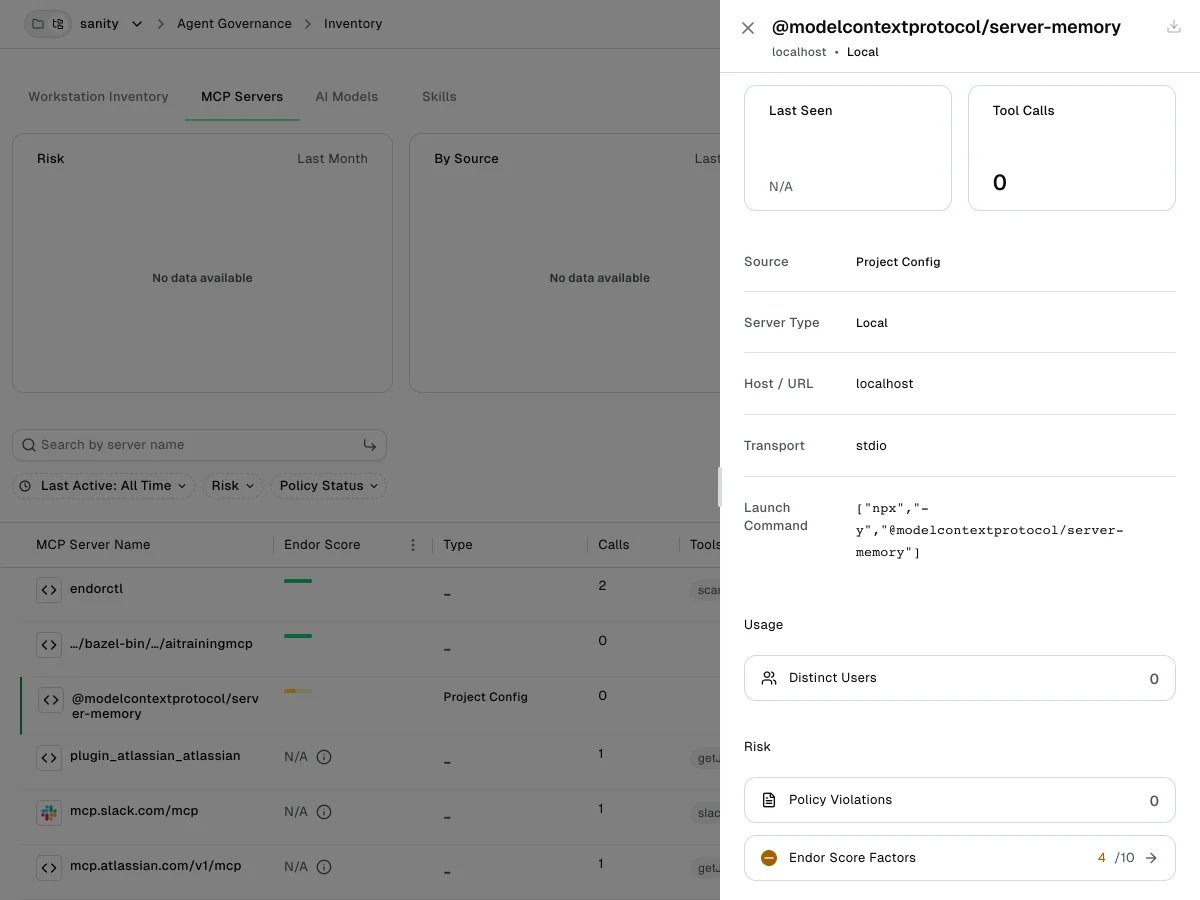
The following steps enable you to identify unsanctioned MCP servers.- Select a server to open its detail drawer. It opens with Last Seen and Tool Calls cards.
- Review the details section: the source, server type, host, transport, launch command, available tools, and environment variable names.
- Under Usage, select Distinct Users to open the users panel.
- Under Risk, select Policy Violations to open that server’s violations, or Endor Score Factors to open the per-dimension Endor Score breakdown in a side panel.
MCP server sources
The Type column, the By Source pie chart, and the drawer’s Source field classify each server by where it comes from. Whether the server runs locally or remotely is a separate signal, shown as Server Type in the drawer. A server shows a dash until a policy classifies it. That covers servers last seen before your hooks picked up source classification, and events the hook had no configuration snapshot to check against. The classification updates as new events arrive. Endor Labs doesn’t score agent plugins as a single unit. It evaluates the MCP servers and skills a plugin contributes. See How Coding Agent Governance works for related inventory limits.AI Models
The AI Models tab shows the language models invoked through your agents. Above the table, a Top Models by Sessions list ranks the most-used models and a Top Providers by Sessions list ranks their providers in the selected time range. Every column in the table is sortable, and the filters narrow the table to one agent or provider.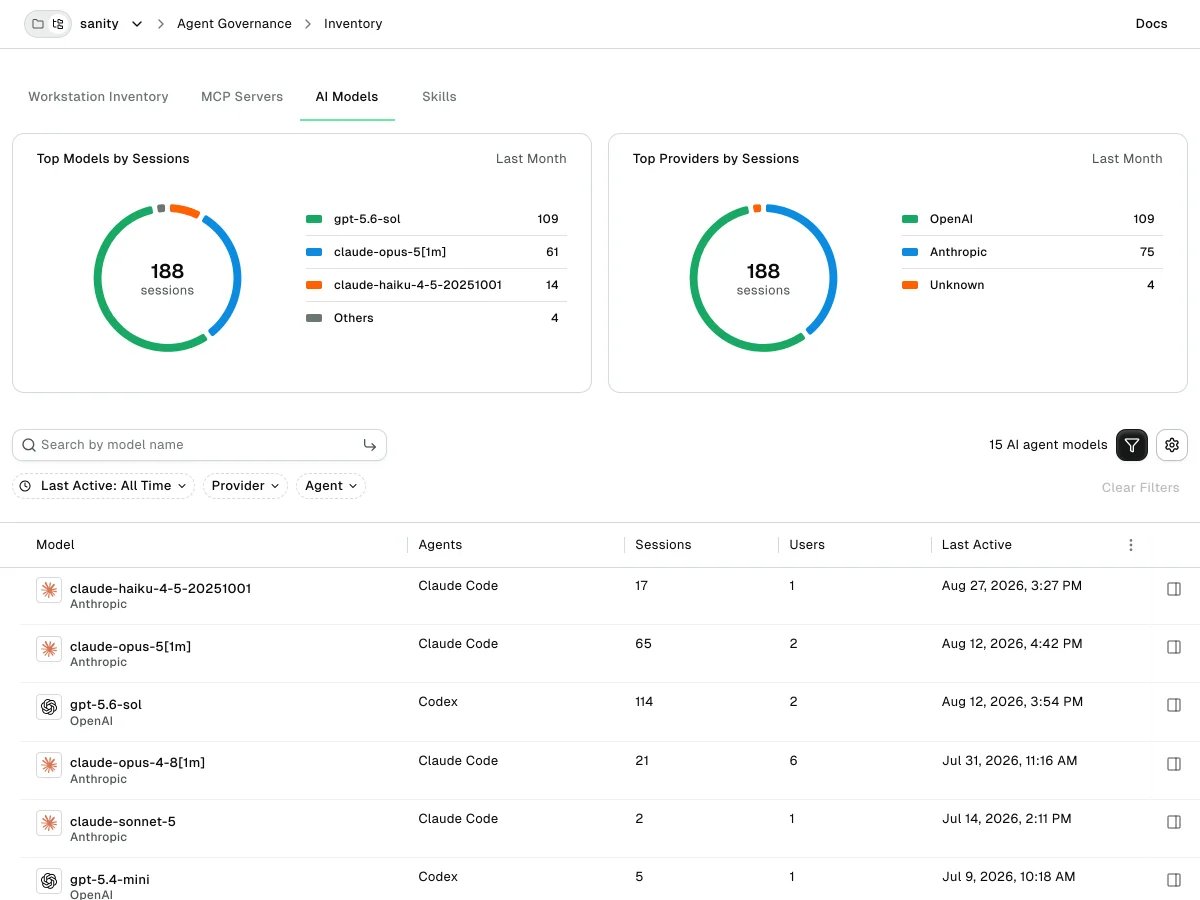
Skills
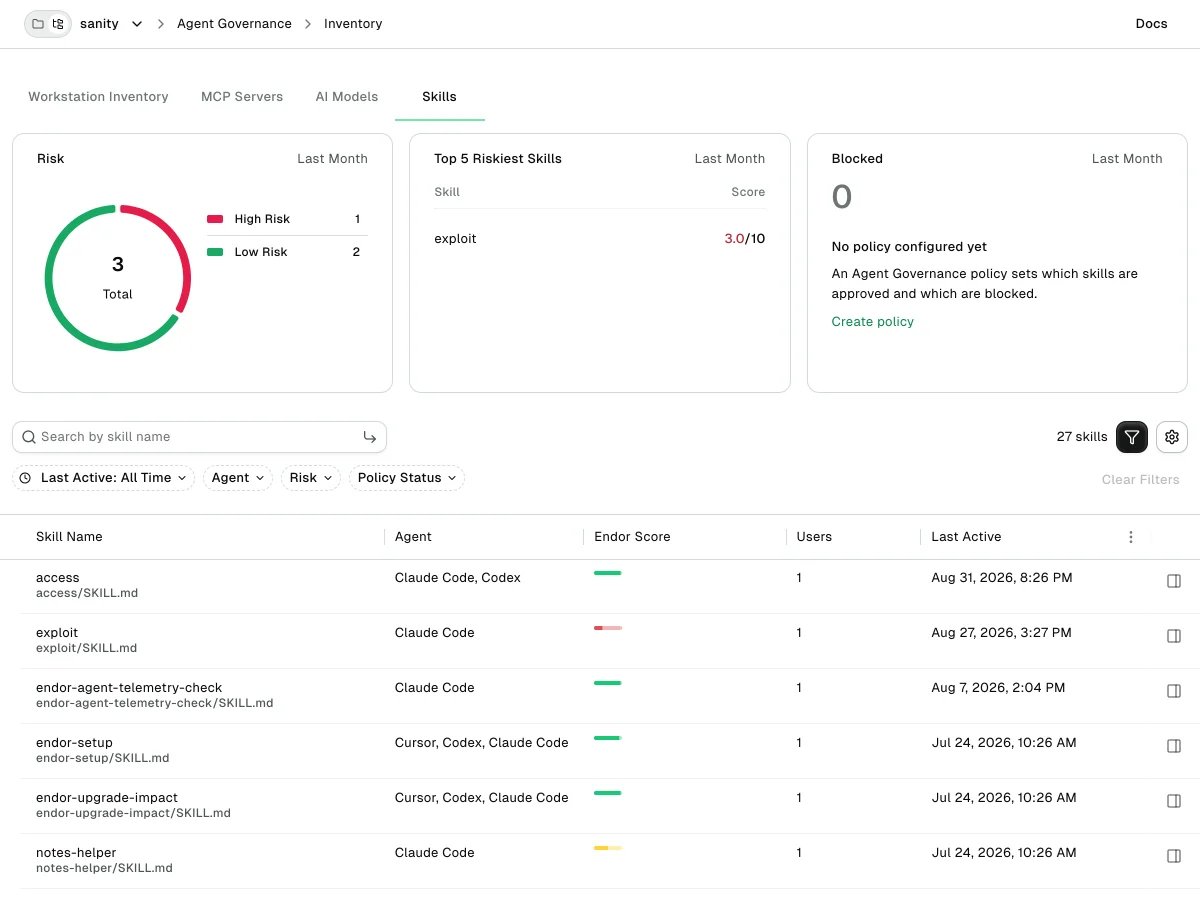
The Skills tab shows the skills your agents loaded during sessions. The following cards summarize the skills your agents loaded in the last month:- Risk: A donut chart that buckets skills by the risk band derived from their Endor Score.
- Top 5 Riskiest Skills: The lowest-scoring skills by Endor Score.
- Blocked: The count of skills your policies block.
Review a skill
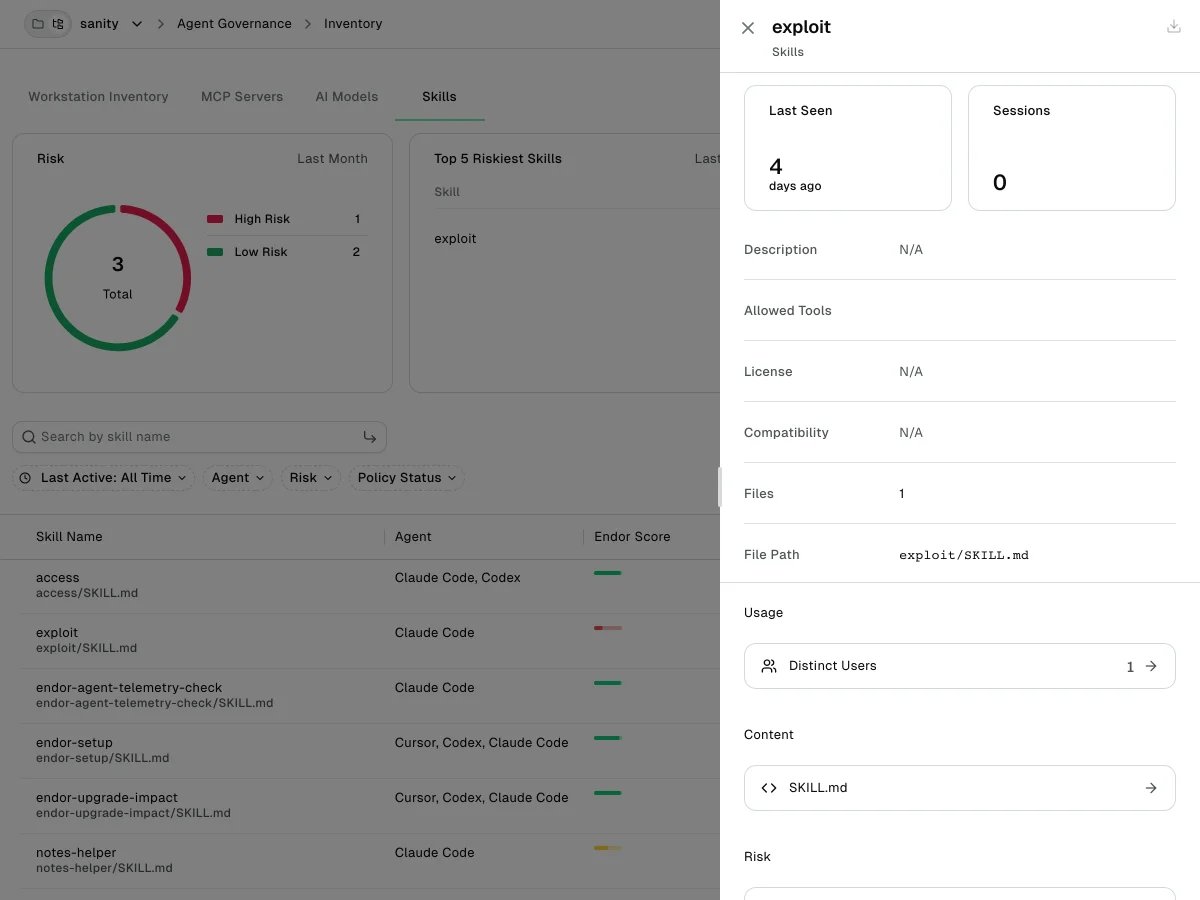
The following steps enable you to review a skill’s metadata, content, users, and risk.- Select a row to open the skill’s detail drawer. It opens with Last Seen and Sessions cards.
- Review the frontmatter metadata: description, allowed tools, license, compatibility, file count, and file path.
- Under Content, open the captured
SKILL.mdin a side panel. - Under Usage, select Distinct Users to open the users panel.
- Under Risk, select Endor Score Factors to open the per-dimension score breakdown.
How skills are discovered
At every session start, the hook scans forSKILL.md files in two directory scopes and reports every skill it finds on the session-start event.
Cursor scans across the common agent skill directories so that a skill installed for any supported agent appears in the inventory.
SKILL.md format
Each skill is a directory that contains a SKILL.md file with YAML frontmatter.
name: Used as the skill identifier. If it’s missing, the inventory uses the parent directory name instead.description: Shown on the skill row and detail page.license: Surfaced alongside the skill for compliance review.compatibility: Free-text dependency requirement.allowed-tools: List of tools the skill may call. Accepts a YAML list or a space-separated string.
Discovery limits and behavior
Skill discovery works within the following limits:- A single event carries up to 100 skills. The hook skips any additional skills.
- The hook truncates each skill’s content to 128 KiB and caps a single event payload at 10 MiB. When a skill’s content would push the payload past the cap, the hook reports that skill with metadata only.
- The hook skips directories named
.git,node_modules,vendor,__pycache__, and.venvto keep discovery fast. - The hook doesn’t follow symbolic links.
- If two skills share the same
name, the first one encountered wins. Workspace directories scan before user-home directories. - The hook skips
SKILL.mdfiles it cannot read, so a single corrupt skill doesn’t break inventory. A readable file with malformed frontmatter still appears, using the directory name as the skill name.
The hook doesn’t capture skills the agent loads at runtime from outside the scanned directories.
See who uses an item
Every detail drawer carries a Usage section with a Distinct Users entry showing the all-time count of developers observed using the item. Select the entry to open the users list in a side panel. The list shows every developer who has used the item, when they were first seen, and how active they have been over the last 30 days. When an item looks risky, it tells you which developers to talk to and whether they still use it.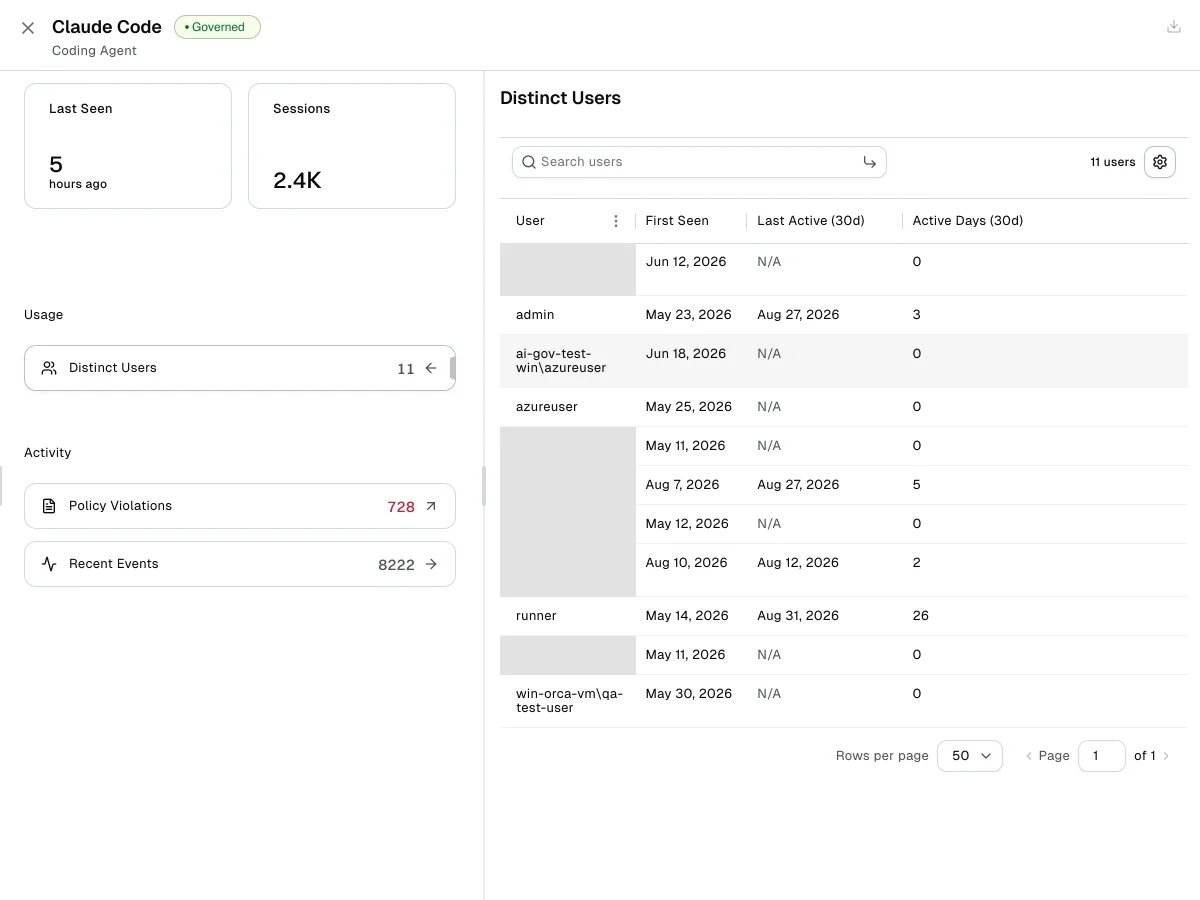
Next steps
Continue with the following pages:- See Write a policy to act on what the inventory shows.
- See Read the Coding Agent Governance overview to track inventory trends across a time range.