View and analyze your projects, findings, packages, dependencies, and security posture.
Inventory & Insights provides a comprehensive view of your software assets and security analysis results. This section covers everything from organizing your projects and namespaces to viewing detailed findings, tracking dependencies, and visualizing your security posture through dashboards.
Projects in Endor Labs represent your source code repositories. When you scan a repository, Endor Labs creates a corresponding project.
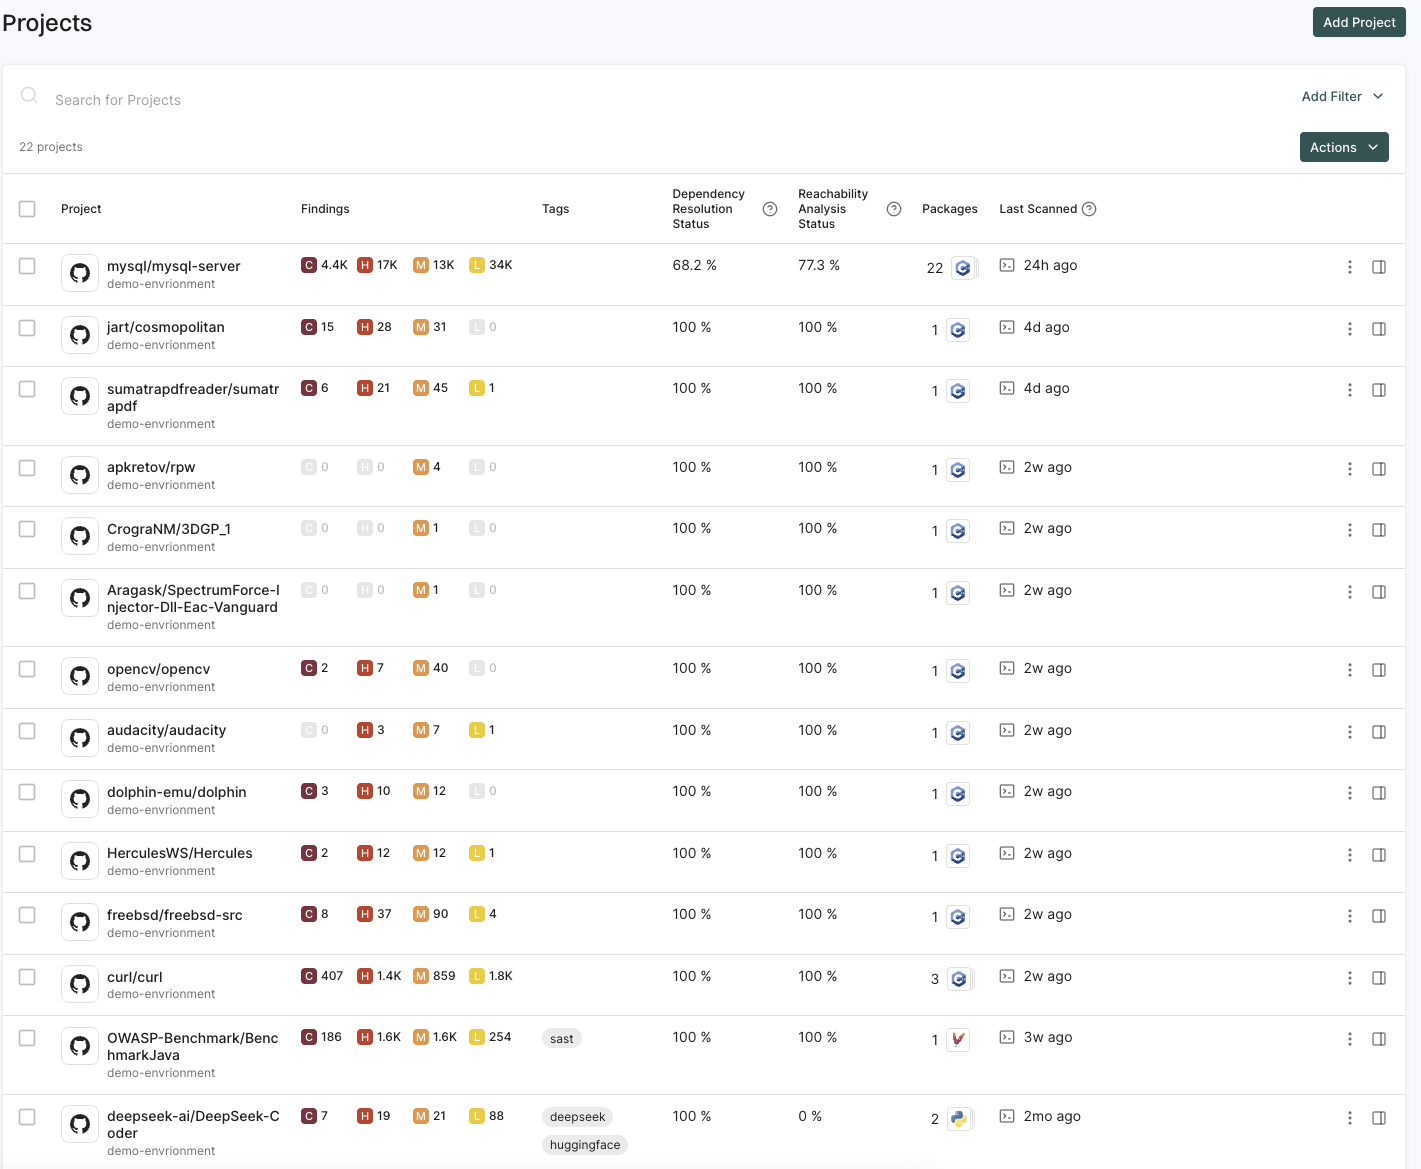
Select Projects from the left sidebar to view a list of all projects in your namespace.
You can view the following details in the Projects list:
Source Code Management Platform - The icon that represents the source code management platform like GitHub, GitLab, Azure DevOps and Bitbucket.
Project - The name of the project. Usually denoted as SCM Organization/Project Name.
Findings - The condensed view of the number of critical, high, medium, and low severity findings in the project.
Tags - The tags associated with the project.
Packages - The number of packages in the project.
Dependency Resolution Status - The percentage of packages that have been fully analyzed with no dependency resolution errors.
Reachability Analysis Status - The percentage of packages eligible for reachability analysis that have been fully analyzed with no call graph errors.
Last Scan - The elapsed time since the project was last analyzed by Endor Labs.
To sort projects by any column, click the column header to toggle the sort order between ascending (A–Z or oldest to newest) and descending (Z–A or newest to oldest), depending on the column type.
View project details
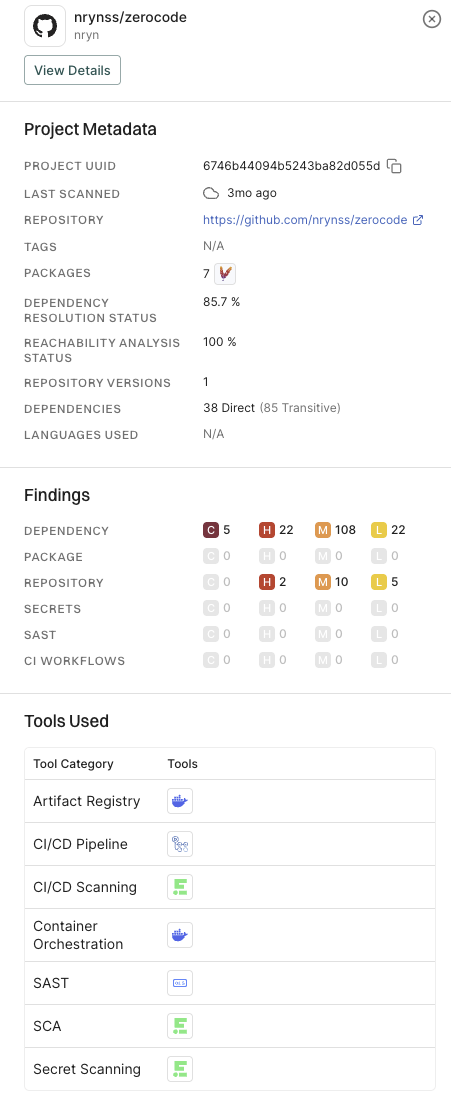
Select a row to view the project details. The project details appear in the right sidebar.
In project details, you can view the project metadata, finding details, and tools associated with the project.
View project findings
Click on Project to view the project findings. See Findings for more information.
You can also scan your projects for AI models. See AI model findings for more information.
View packages in a project
Select Packages under Inventory to view the list of all packages maintained as part of your project. See Packages for more information.
Review past scan details
You can view the history of scans performed on a project, which enables you to review the security posture of your project over time. See Scan history for more information.
View dependencies
You can view all the dependencies associated with all the projects in your namespace. See Dependencies for more information.
Filter projects
Filters refine the projects view by applying conditions based on project metadata and scan results. For example, you can filter projects by name, tags, scan date, or number of critical findings. You can combine multiple filters to narrow down results based on several conditions in a single query.
A finding is a discovery of significance made following the completion of a scan. Findings result from the default out-of-the-box implementation of rule sets called Finding policies.
View all findings
To view different types of findings associated with all projects or packages in your tenant:
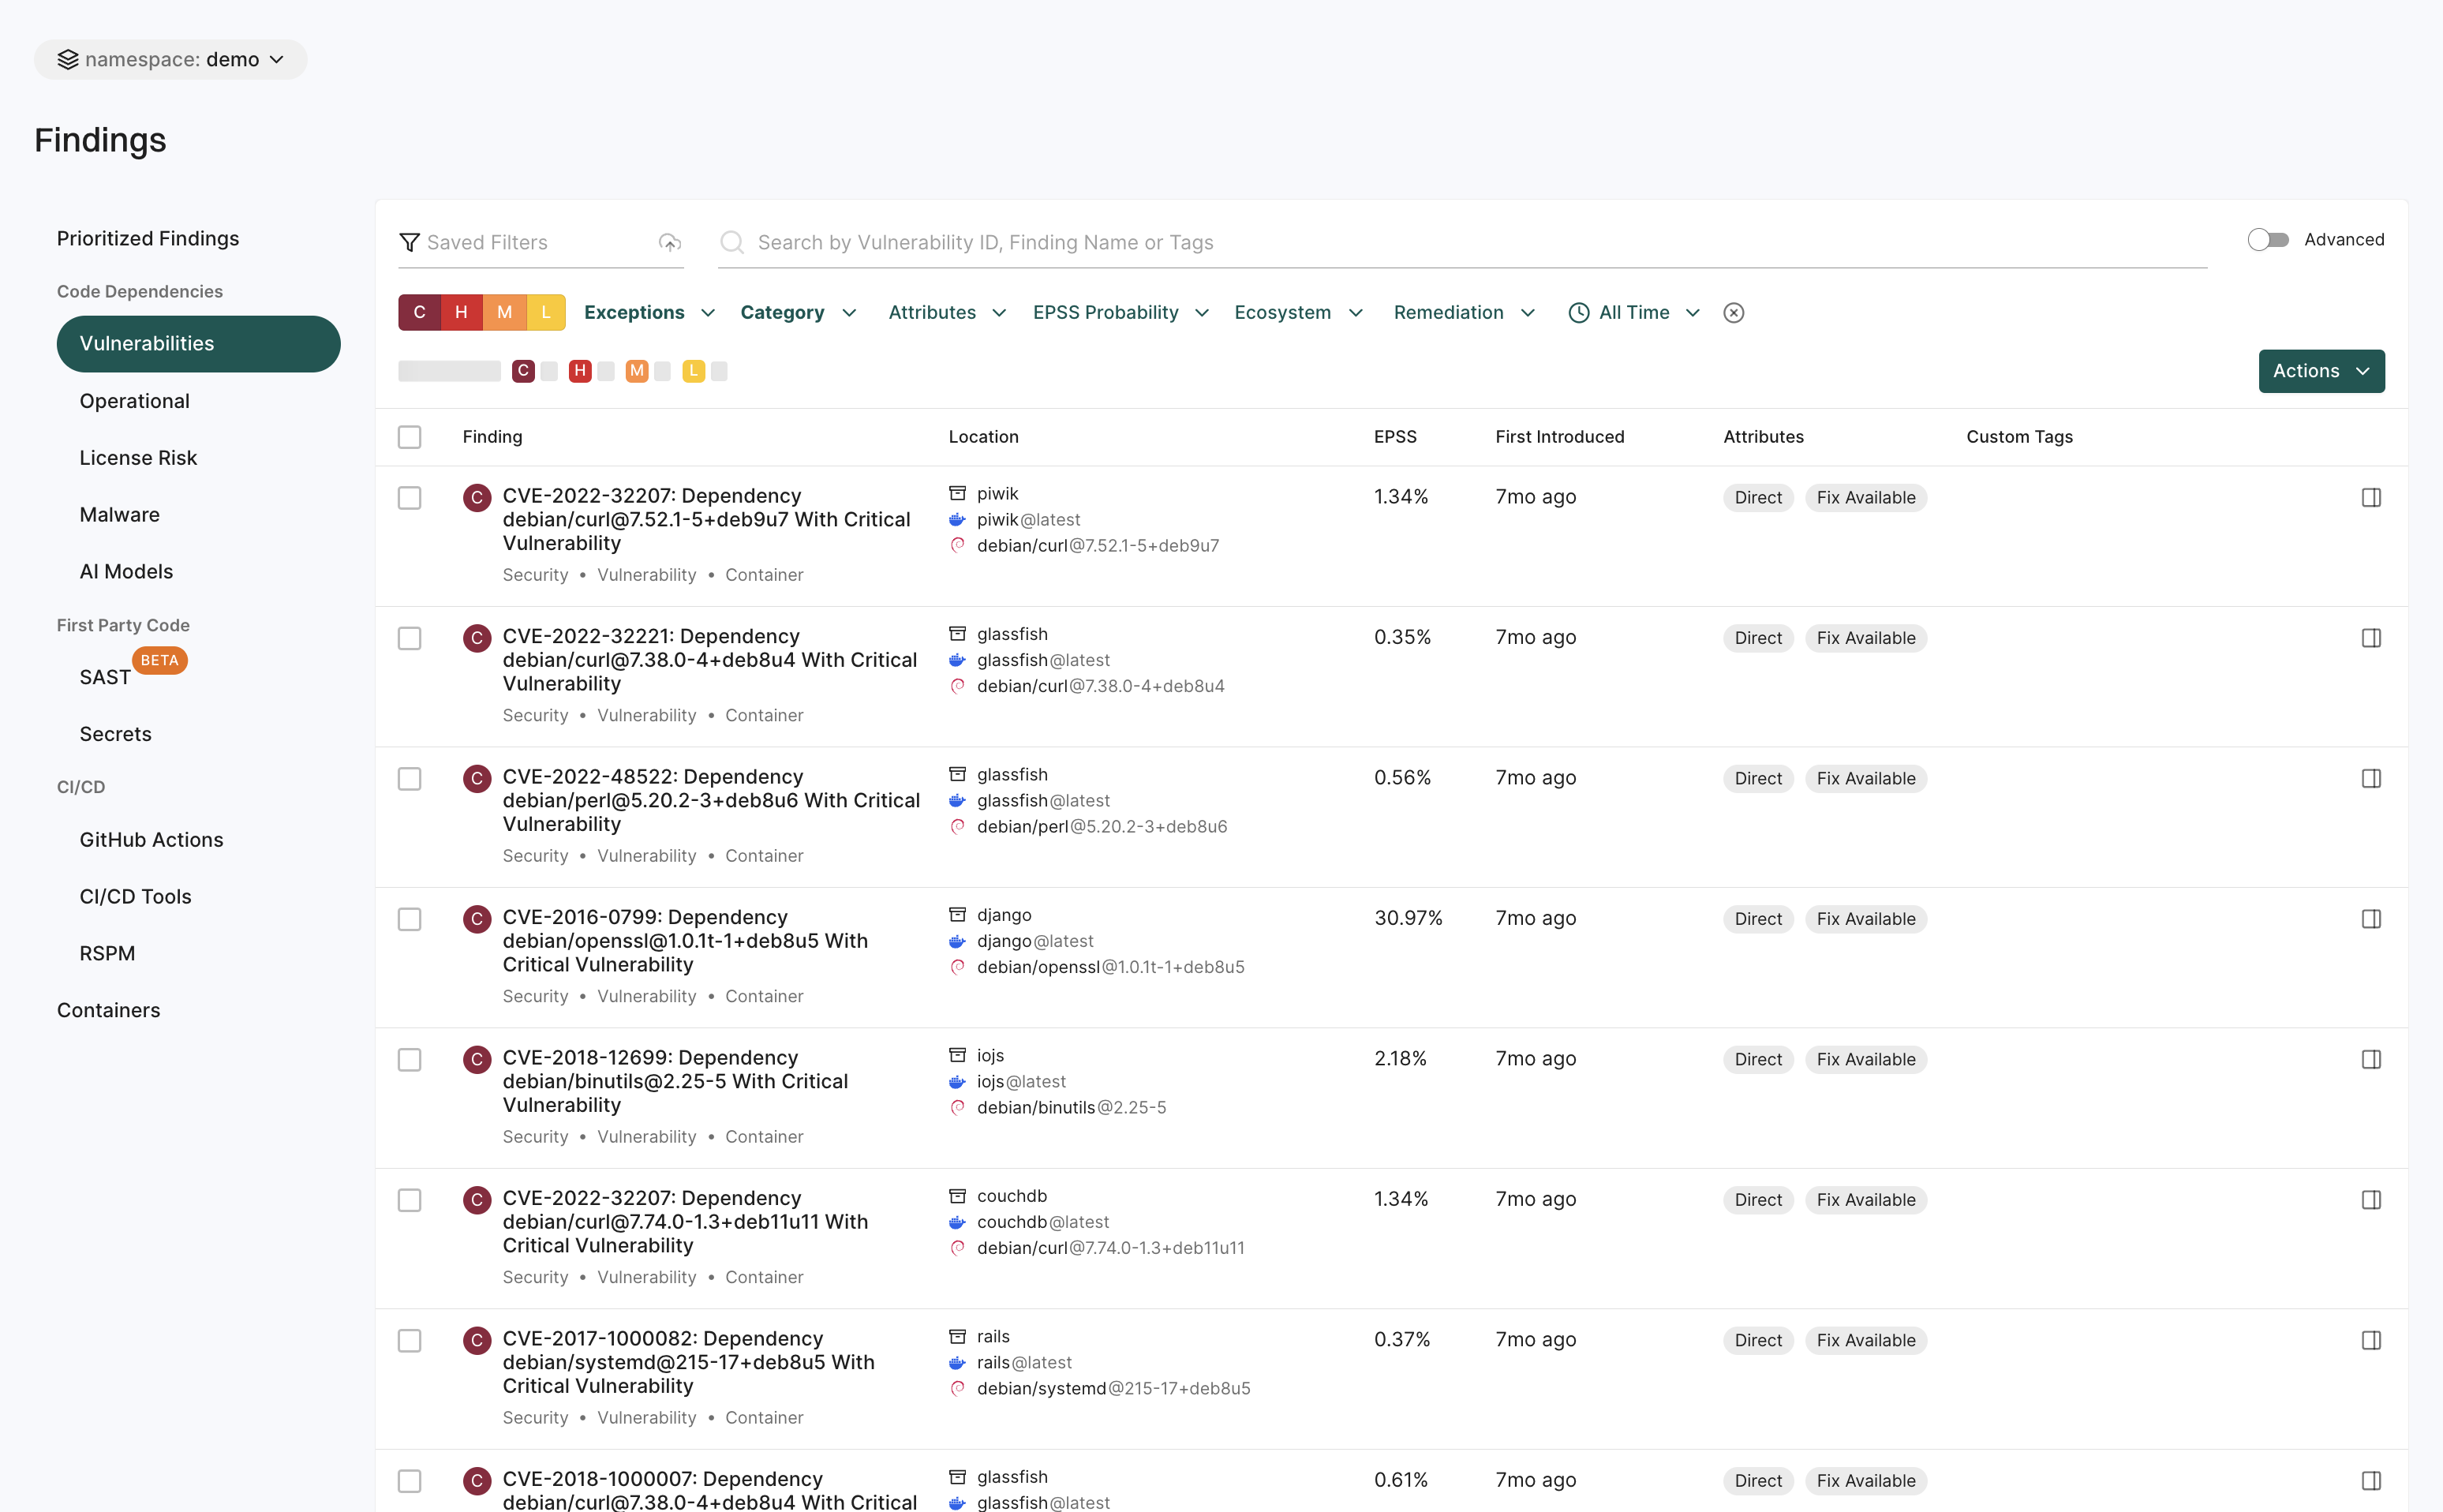
Select Findings from the left sidebar.
The preset filters help you in locating the findings that matter most to you.
Choose from a list of options under Code Dependencies to view a list of SCA, Vulnerability, Operational, License Risk, Malware or AI model findings.
Choose Secrets to find a list of findings related to exposed secrets.
Choose from a list of options under CI/CD to view findings related to GitHub Actions and CI/CD Tools.
Choose RSPM to view findings related to repository’s security posture.
Choose Containers to view container findings.
Use Saved Filters to create and save your frequently used searches, helping you save time.
Use Table preferences to select the columns you want to view and customize the appearance of the findings table.
Select Notifications in Table preferences to view notifications associated with a finding.
Select View Details to view the following:
Project metadata
Risk details and remediation guidance
Notifications associated with the finding and Jira ticket links
Personalized notes for each finding. You can view notes on findings if you have tenant access. Only users with Admin or Code Scanner role can add or edit notes. See authorization roles to learn about roles and permissions.
To export findings, select the findings, and click Actions > Export Selected or Export All.
Dismiss findings
Dismiss findings to exclude them from the active workflow. Dismissed findings are removed from active views and do not trigger policies.
You can dismiss findings in one of the following ways:
Exception Policy: Applies during scan execution and suppresses all findings that match the defined criteria across the selected repository versions or projects.
Snooze: Applies to a single finding instance for a specific target, repository version, and project. It takes effect immediately and is scoped only to the selected finding instance.
Pull request findings cannot be snoozed, as each pull request represents a new repository version. However, you can dismiss PR findings using incremental PR scans, Exception Policy, or ignore files.
Ignore File: Applies during scan execution and suppresses all findings matching the ignore file entries. Ignore files are part of the source code and are only applied to the parent repository version.
Dismiss findings using an exception policy
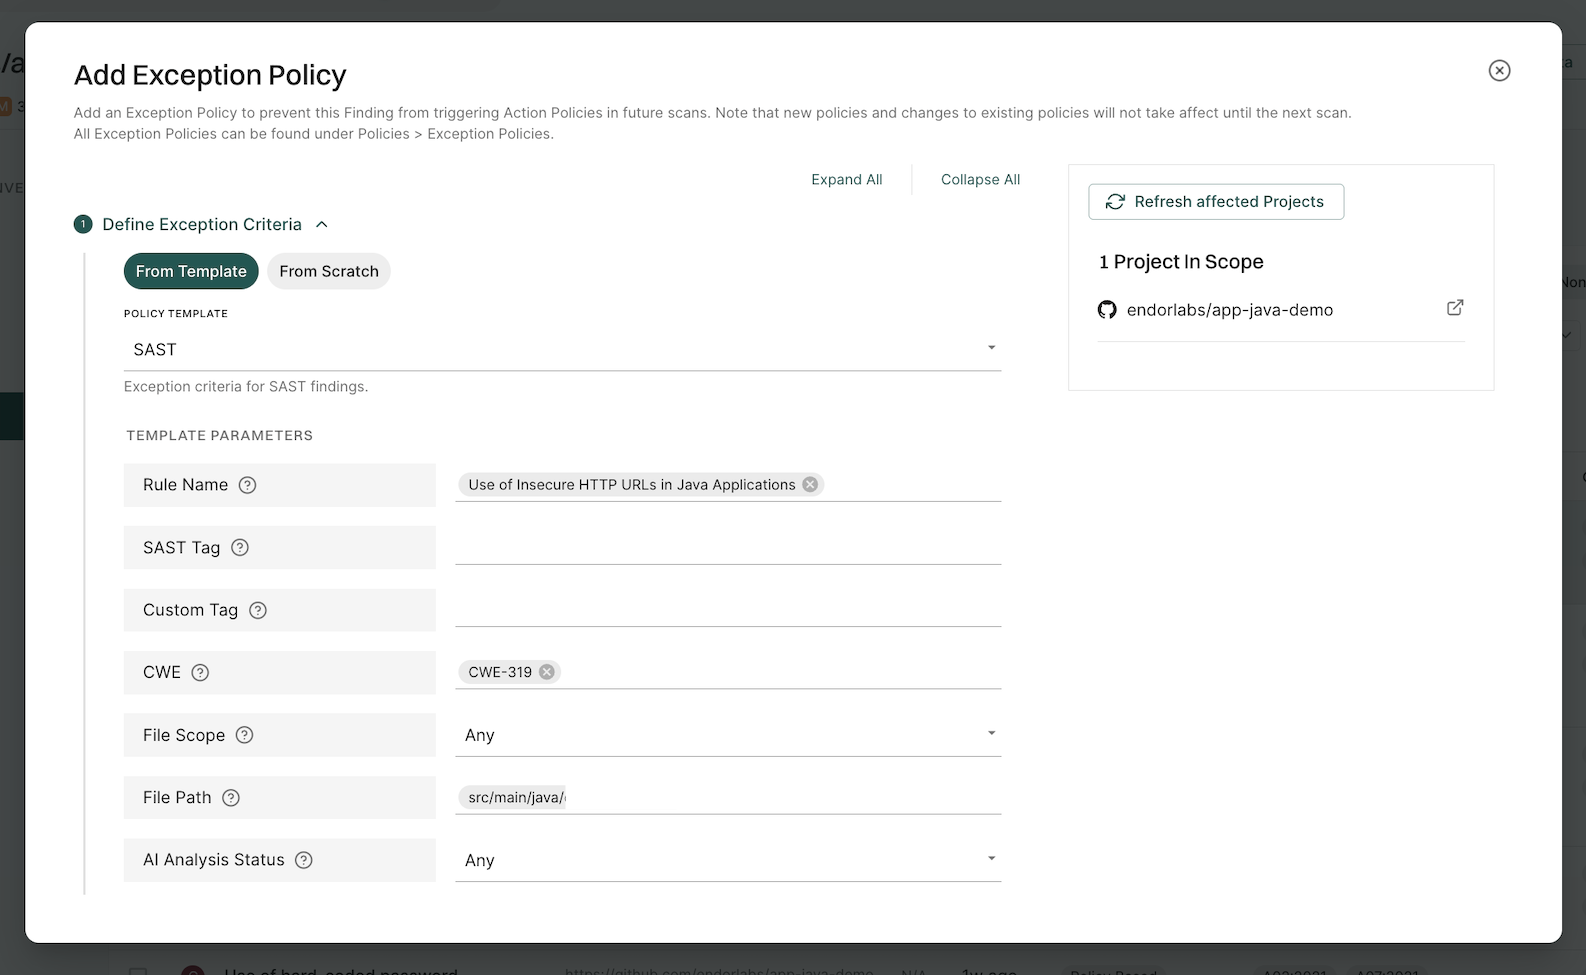
Add an exception policy to prevent a finding from triggering action policies in future scans.
Select Projects from the left sidebar.
Search for and select a project, and select Findings.
Search for findings using advanced or basic filters.
Select findings and click the vertical three dots.
Select Add Exception.
Use the Grouped By filter to group multiple findings and apply exceptions to them at once.
Snooze a finding to temporarily dismiss it and choose when it should reappear for findings that do not require immediate action or a permanent exception policy. To dismiss multiple findings, or a single finding across multiple repository versions or projects, create an exception policy.
Note
You require Admin or Code Scanner role permissions to snooze findings and edit snooze parameters. See authorization roles to learn about the different roles Endor Labs offers.
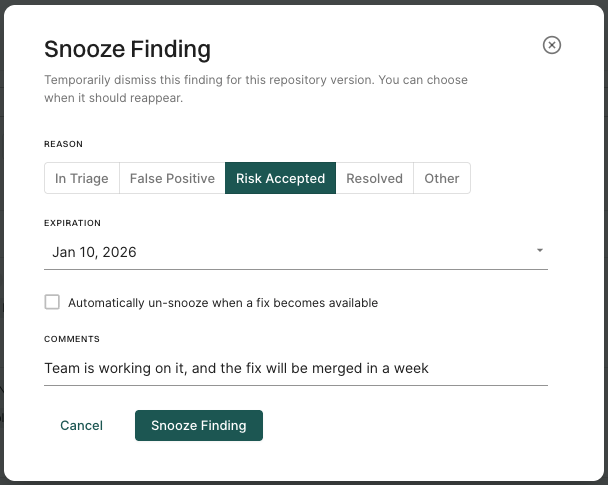
To snooze a finding:
Open the finding details.
Click Snooze.
Select the most appropriate reason to indicate why the finding is being snoozed.
Optionally, select Expiration to specify when the finding should reappear. If you set an expiration date, the finding will be automatically un-snoozed by the first scan on the expiration date.
Optionally, for vulnerability findings, select Automatically un-snooze when a fix becomes available to have the finding reappear after the first scan once a fix becomes available.
Optionally, add a comment to provide context for the snooze.
Click Snooze Finding.
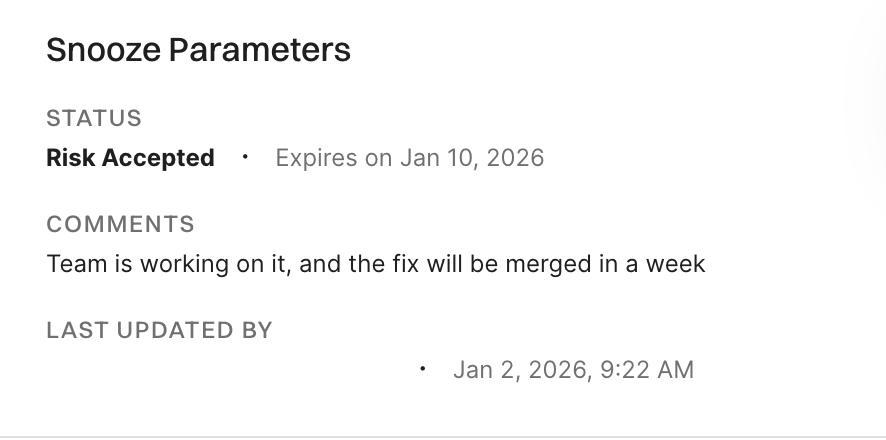
A finding can be temporarily snoozed while a fix is in progress, with details such as the reason, expiration date, and remediation timeline recorded for context.
View snoozed findings
To view snoozed findings:
Select Findings from the left sidebar.
Select Dismissed from saved filters and select Yes.
Select Snoozed to view snoozed findings only.
Use the filter form to refine results by reason, or expiry range.
Click on a snoozed finding to view its details.
You can view snooze parameters, including status, expiration date and time, and comments, in the finding details panel. The last updated timestamp shows when the snooze was created or last modified, which helps you track changes and verify if someone else has modified or un-snoozed the finding.
When you un-snooze a finding, it immediately reappears in your findings list and dashboards. The finding becomes active again, and action policies will process it during the next scan.
To un-snooze a finding:
Select Findings from the left sidebar.
Select Dismissed from saved filters and select Yes to view snoozed findings.
Click on a snoozed finding to view its details.
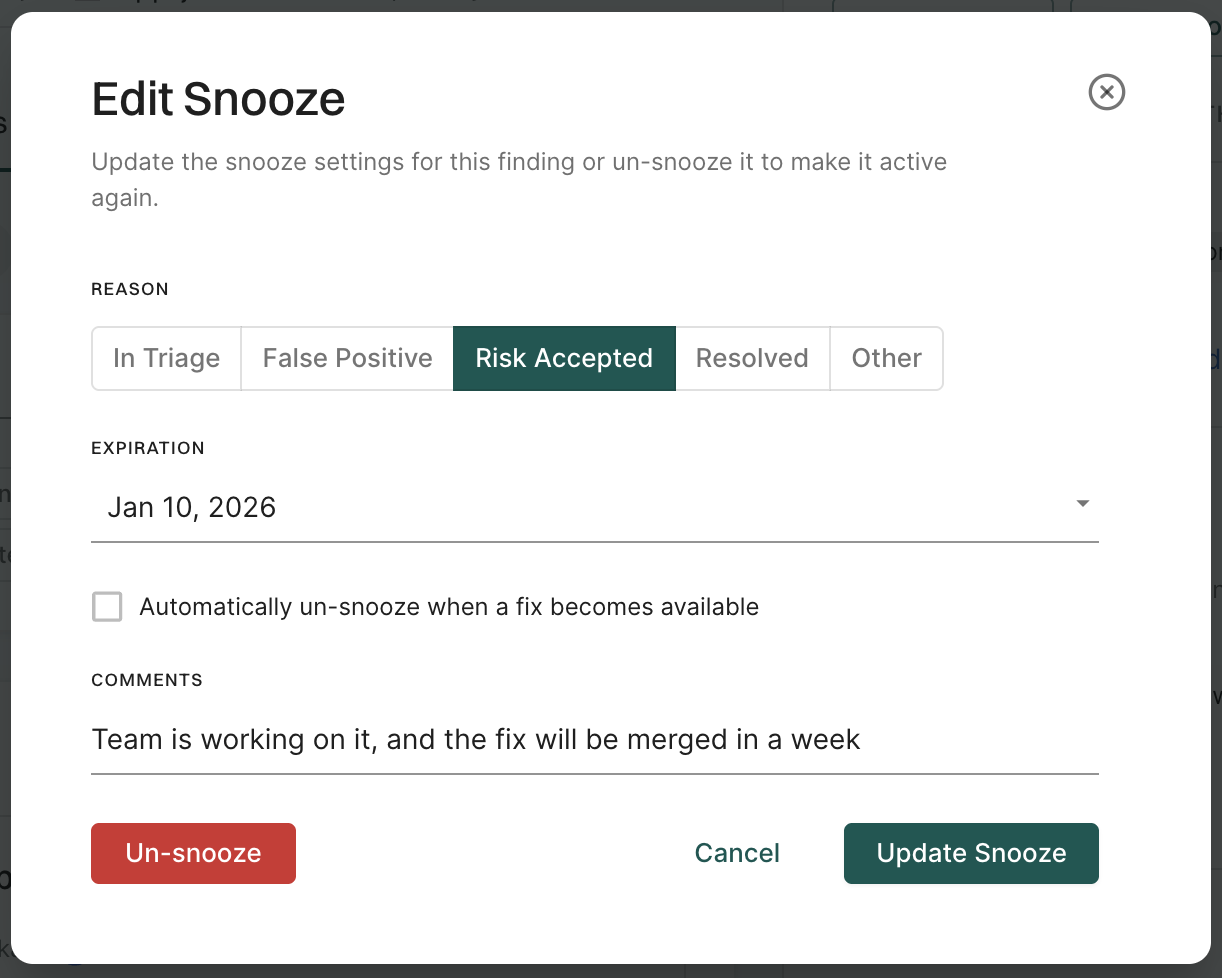
Click Edit snooze and then click Un-snooze.
Update snoozed findings
To update snooze settings of a finding:
Select Dismissed from saved filters and select Yes to view snoozed findings.
Click on a snoozed finding and click Edit snooze.
Edit snooze settings such as expiration date, reason, or comments, and click Update Snooze to save the changes.
Dismiss findings using an ignore file
Ignore files let you dismiss findings by committing a file in your repository. They are applied during scan execution and only affect the repository version that contains the file (the parent of the scan). Any finding that matches an entry in the ignore file is suppressed and does not appear in the findings list or trigger action policies.
Yaml format: A list of ignore entries. Each entry specifies the finding by name, dependency, or other fields, plus metadata such as reason, expiration date, and comments.
Raw vulnerability IDs: A plain list of vulnerability identifiers (for example, CVE or GHSA), one per line, for vulnerability findings only. No yaml structure is required.
By default, the supported file name is .endorignore.yaml. Your administrator can configure additional file names in Developer Workflows. It is recommended to set up CODEOWNERS for all ignore file names so that changes require approval before merge.
Ignore file yaml syntax
The ignore file contains entries that specify the findings to suppress during scans. Use the endorctl ignore command to create the file if needed and format the yaml entries automatically. Use the endorctl validate ignore command to validate the file after changes or branch merges.
The file must include a top-level version and an ignore key whose value is a list of entries. The following fields are supported in each entry.
Field
Description
id
Unique identifier for the entry.
finding_name
Name of the finding to match. At least one of finding_name or vuln_id must be specified in each entry.
vuln_id
Vulnerability ID to match, such as a CVE or GHSA ID. At least one of finding_name or vuln_id must be specified in each entry.
dependency_name
Name of the dependency to match. Partial values are supported, for example you can specify the dependency name without a version.
parent_name
Name of the parent package that declares or pulls in the dependency. Partial values are supported, for example you can specify the package name without a version.
username
Developer who requested the exception.
reason
Reason for ignoring the finding. Allowed values are false-positive, risk-accepted, in-triage, resolved, or other. Default is risk-accepted.
expiration_date
Date when the ignore entry expires, in YYYY-MM-DD format.
expire_if_fix_available
Indicates whether the ignore entry should be removed automatically when a fix becomes available.
comments
Additional comments describing the reason for the entry.
The following example shows a valid ignore file in yaml format with a version, an ignore list, and entries that use the fields described above.
version:1.0.0ignore:- id:endorignore-1username:alice@corp.comfinding_name:Unmaintained Dependency some-package@1.0reason:risk-acceptedexpiration_date:2026-06-01comments:"Tracking upgrade in JIRA-123"- id:endorignore-2vuln_id:CVE-2025-12345parent_name:some-ut-package-namereason:otherexpire_if_fix_available:truecomments:"No fix available and this package is only used for testing"- id:endorignore-3username:bob@corp.comfinding_name:"Potential secret leak Generic API Key: ID #dace33"reason:resolvedcomments:"I revoked my token"
Ignore file plain text format
Vulnerability findings can be ignored by listing the vulnerability IDs in a plain text file.
# Ignore list for approved exceptions (AppSec-owned)CVE-2024-12345
GHSA-xxxx-yyyy-zzzz
CVE-2023-99999
View ignored findings
To view ignored findings:
Select Findings from the left sidebar.
Select Dismissed from saved filters and select Yes.
Select Ignored to view ignored findings only.
Use the filter form to refine results by reason, or expiry range.
Click on an ignored finding to view its details.
You can view ignore parameters, including status, expiration date and time, comments, ignore file name and entry id in the finding details panel. The ignore parameters available depend on which fields the developers are required to provide in the ignore file entries.
Filter dismissed findings
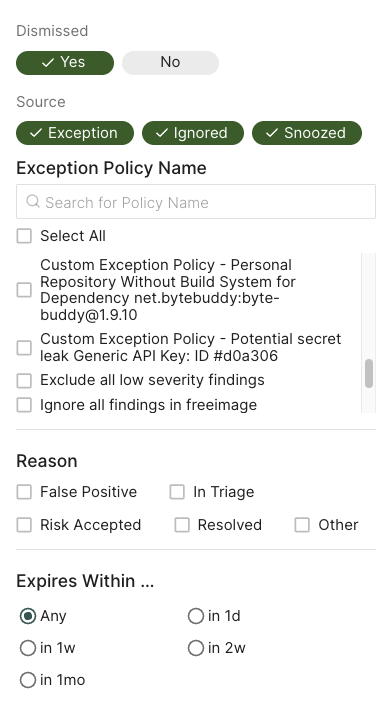
Use the following options to filter dismissed findings.
Select Yes to view only dismissed findings in the findings table.
Select No to hide dismissed findings from the findings table.
Deselect both Yes and No to include dismissed findings in the findings table along with the rest of the findings.
Select Exception, Ignored, and/or Snoozed, to filter on the method by which the finding was dismissed.
For exception findings, choose from one of the existing exception policies in the list or search for a specific exception using Search for Policy Name.
Select Reason to filter dismissed findings by reason.
Select Expires Within to filter dismissed findings by expiration time-frame.
View findings associated with a project
To view the findings associated with a project:
Select Projects from the left sidebar.
Select the project for which you want to view the findings.
The Findings page includes the list of findings specific to the project.
Review the list of findings. Click the finding to see its details.
Use Grouped By to group findings by attributes such as dependency, location, package, CWE, tags, code owner or rule name to filter and manage them collectively.
Finding attributes
Finding attributes are characteristics or properties associated with each discovered issue or result obtained from a scan. These attributes could include the following details and metadata.
Attribute
Description
Blocker
Finding was marked as blocking by an action policy.
Direct
Finding applies to a direct dependency.
Disputed
The CVE reported in this finding is has been marked as ‘disputed’.
Exception
Finding was marked as exempt from action policies by an exception policy.
Exploited
The CVE reported in this finding is actively exploited and is listed in the Known Exploited Vulnerabilities (KEV) database.
External Path Only
Finding applies to a transitive dependency that can only be reached via external, non-OSS, project paths.
First Party
Finding applies to a dependency that belongs to the same namespace.
Fix Available
A fix is available for the CVE reported in this finding.
Invalid Secret
Finding applies to an invalid secret.
Malware
Finding applies to a malicious package.
Normal
Finding applies to a normal, non-test, dependency.
Notification
Finding triggered a notification based on an action policy.
Phantom
Finding applies to a phantom dependency.
Potentially Reachable Dependency
Finding applies to a potentially reachable dependency.
Potentially Reachable Function
Finding applies to a potentially reachable function.
Reachable Dependency
Finding applies to a reachable dependency.
Reachable Function
Finding applies to a reachable function.
Same Repository
Finding applies to a dependency that belongs to the same project.
Self
Finding applies only to the analyzed package version, there is no dependency involved.
Test
Finding applies to a dependency that is not in production code.
Transitive
Finding applies to a transitive (indirect) dependency.
Under Review
Finding applies to suspicious package under review.
Unfixable
There is no fix available for the CVE reported in this finding.
Unreachable Dependency
Finding applies to an unreachable dependency.
Unreachable Function
Finding applies to an unreachable function.
Valid Secret
Finding applies to a valid secret.
Warning
Finding triggered a warning based on an action policy.
Withdrawn
The CVE reported in this finding is has been marked as ‘withdrawn’.
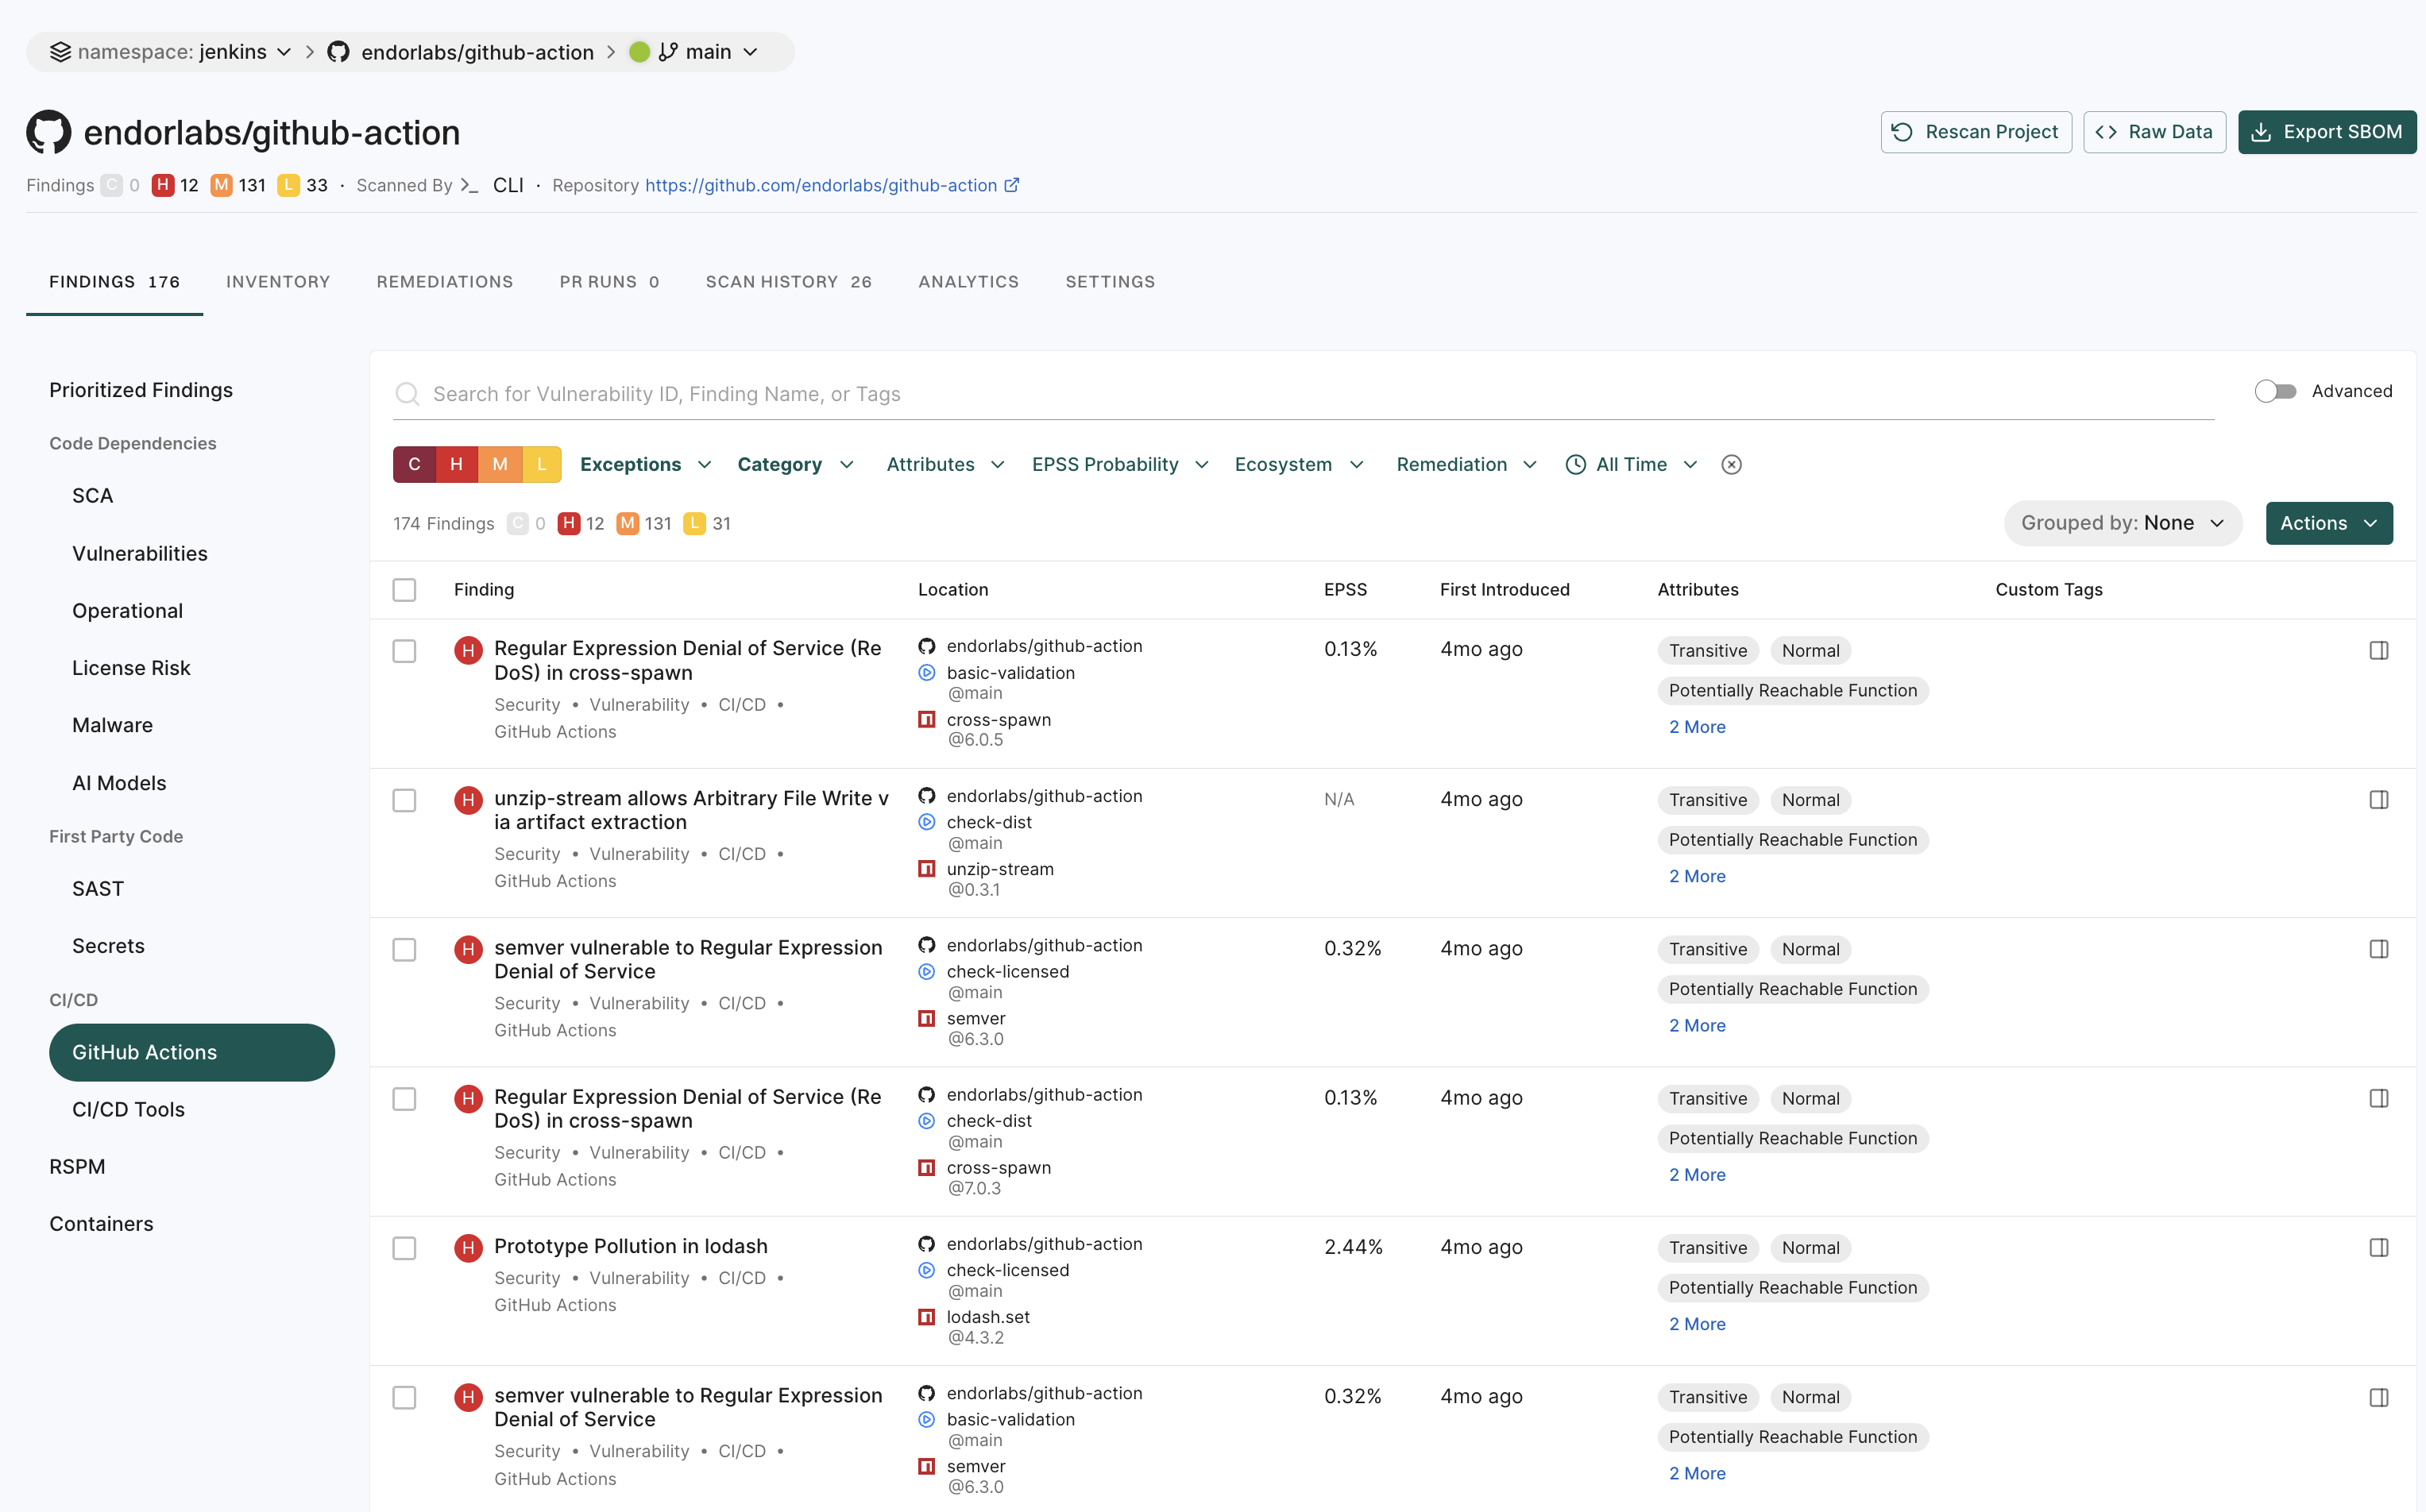
View GitHub Action findings
GitHub Actions is a CI/CD platform that allows you to automate your build, test, and deployment pipelines. You can create workflows that build and test pull requests to your repository, or deploy merged pull requests to production. To mitigate vulnerabilities within the supply chain, comprehensive visibility into GitHub Action workflows and their relationships in your repository is crucial. You can then proceed to identify and fix weak points within the system.
When you run an endorctl scan, it detects GitHub Action workflows used in your repository. It proceeds to scan all the repositories included in the detected workflows and creates findings. The GitHub Action is mapped as a package and discovers direct and transitive dependencies.
To view GitHub Action findings:
Select Projects from the left sidebar.
Search for and select a project and select Findings.
Click GitHub Actions under CI/CD to view GitHub Actions findings.
Note
Vulnerabilities and dependencies associated with GitHub Action packages written in JavaScript or TypeScript are detected by Endor Labs.
Private GitHub Actions and private reusable workflows referenced from other repositories are not detected.
Test dependencies are not detected for GitHub Action packages.
Search for findings using basic filters
Use the following basic filters to search for information in your findings.
C - Findings with critical severity.
H - Findings with high severity.
M - Findings with medium severity.
L - Findings with low severity.
Dismissed - Include or exclude dismissed findings. See Filter dismissed findings to learn more about filtering dismissed findings.
Category - Choose from CI/CD, Malware, license risks, operational risks, RSPM, GitHub Actions, SAST, AI models, containers, secrets, security, supply chain, or vulnerability and view related findings.
Projects - Narrow findings by one or more project names.
Remediations - Narrow down vulnerabilities based on their fix status. Endor Patch Available filters findings where an Endor-provided patch is available to fix the vulnerability. Recommended Upgrade Available filters findings where a recommended version upgrade is available.
Attributes - Narrow down the list based on a range of factors such as:
if a patch is available to fix the findings
if the vulnerable function is reachable
if the dependency is reachable
if the dependency originates from a current repository or a current tenant
if the dependency is a test dependency
if the dependency is a phantom dependency
if the finding originates from itself, direct, or a transitive dependency
filter the findings by the Exploited tag from CISA KEV
filter the findings by the Warn or Break the Build options set in the action policy
EPSS Probability - Choose the Exploit Prediction Scoring System (EPSS) score range.
All Time - Choose a time range.
Eco System - Choose from available options to filter based on a language or an ecosystem.
Search for findings using advanced filters
Use advanced filters to create powerful queries that drill deeper into the dataset to fetch results with a specific context.
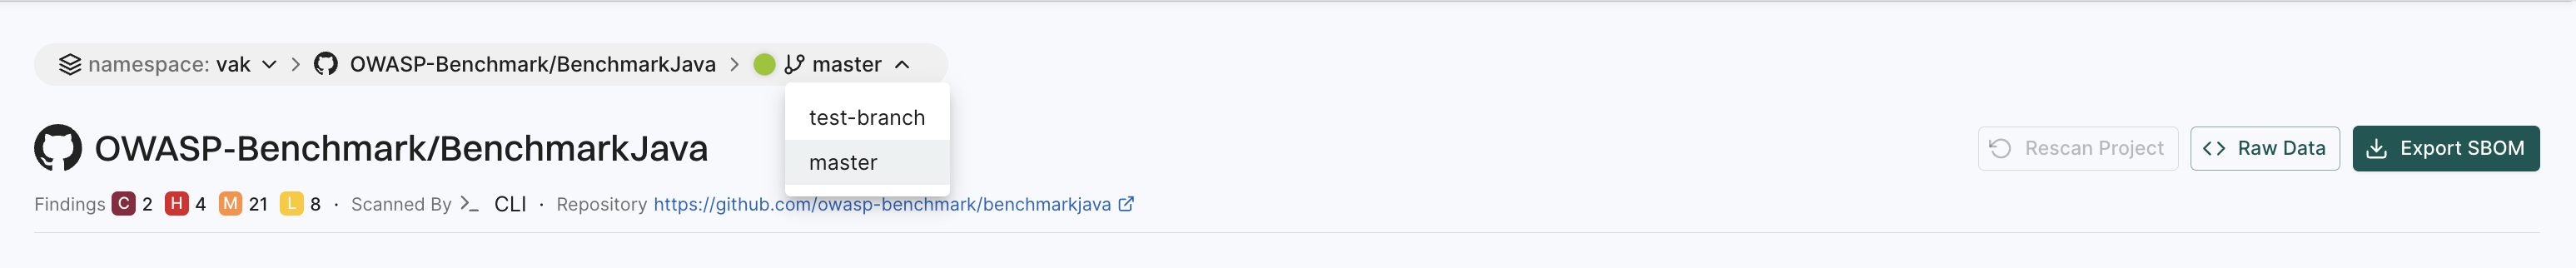
Search using the advanced filters applies to all the branches of a repository. You can retrieve results from any branch by specifying the relevant context ID or type.
For example:
If the default branch for the BenchmarkJava repository is set to master, applying filters with the context ID for master shows results specific to branch.
To scan from the default branch, run the following command :
endorctl scan --path=.
Similarly, if there is another branch named test-branch, switching to that branch shows results specific to the branch.
To scan the branch, run the following command:
git checkout test-branch
endorctl scan --path=.
After running the sans, you can view the findings specific to the branches in the Endor Labs user interface.
Select Projects from the left sidebar.
Select the project for which you want to view the findings.
At the top left of the page, you’ll find a drop-down menu that allows you to select the specific branch. The default branch of the repository is selected by default.
In the following example, master is the default branch. To view findings from other branches (for example, test-branch), choose the desired branch from the drop-down menu.
Tip
Check Projects to see the default branch of your project. To change the default branch, use --as-default-branch while performing the endorctl scan. See scanning strategies for information on testing and monitoring different versions of your code.
The Advanced Filters use the GetFindingAPI call to fetch results.
The following table lists some example attributes, you can use in your custom API calls. See also example combinations below.
Attribute
API Query
Severity
spec.level in ["FINDING_LEVEL_CRITICAL","FINDING_LEVEL_HIGH"]
Show all findings of critical vulnerability and high severity that have a fix available, with a reachable function and EPSS score greater than 10%.
spec.level in ["FINDING_LEVEL_CRITICAL","FINDING_LEVEL_HIGH"] and spec.finding_tags contains ["FINDING_TAGS_FIX_AVAILABLE"] and spec.finding_tags contains ["FINDING_TAGS_REACHABLE_FUNCTION"] and spec.finding_metadata.vulnerability.spec.epss_score.probability_score > 0.1
Show vulnerabilities for a specific project.
spec.finding_categories contains ["FINDING_CATEGORY_VULNERABILITY"] and spec.project_uuid =="660e2bc48c7d4e60a5fc692f"
Show vulnerabilities for a specific language in a specific project.
spec.finding_categories contains ["FINDING_CATEGORY_VULNERABILITY"] and spec.ecosystem in ["ECOSYSTEM_PYPI"] and spec.project_uuid =="660e2bc48c7d4e60a5fc692f"
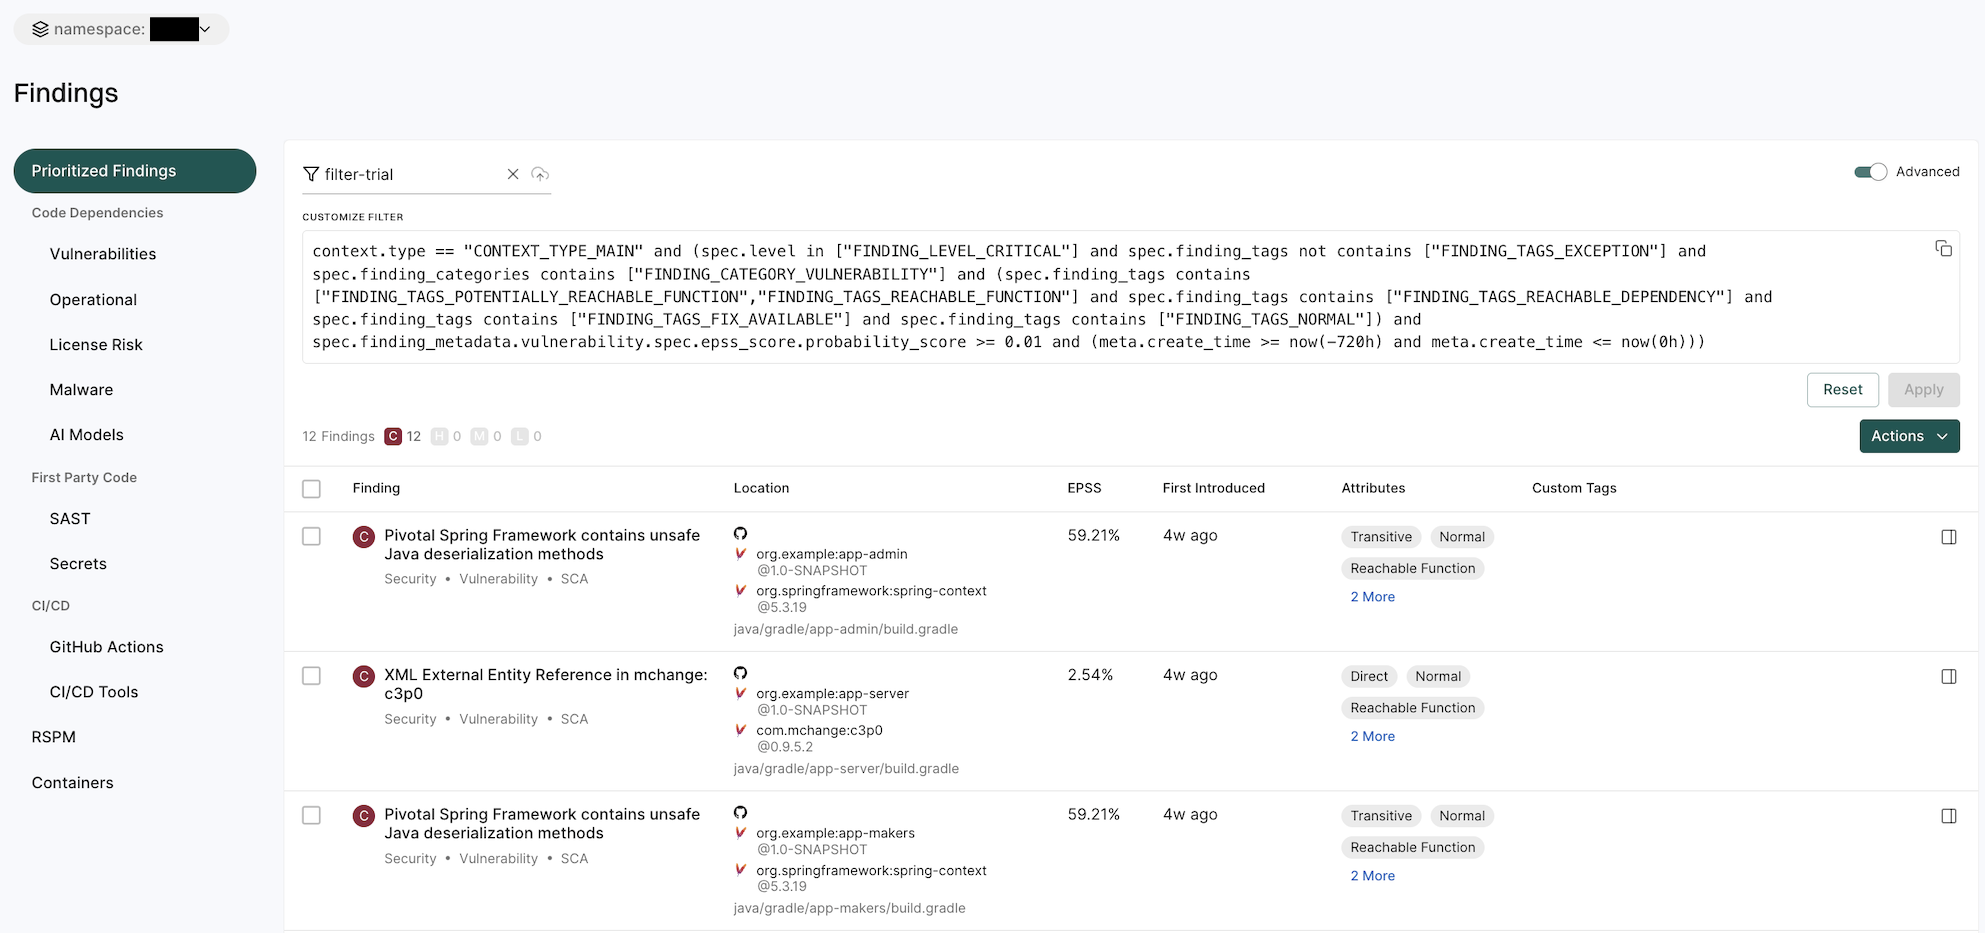
Saved filters
Saved filters are customizable filter settings that users can create and reuse across projects in Endor Labs. They improve efficiency by eliminating the need to manually recreate filters. You can save the advanced search filters that you created to fetch curated search results. Saved queries are visible in the drop-down list.
To create a saved filter:
Select Findings from the left sidebar.
Toggle Advanced in the top right corner.
Type the query in CUSTOMIZE FILTER.
Enter a title in the field with the filter icon.
Click Save New Filter.
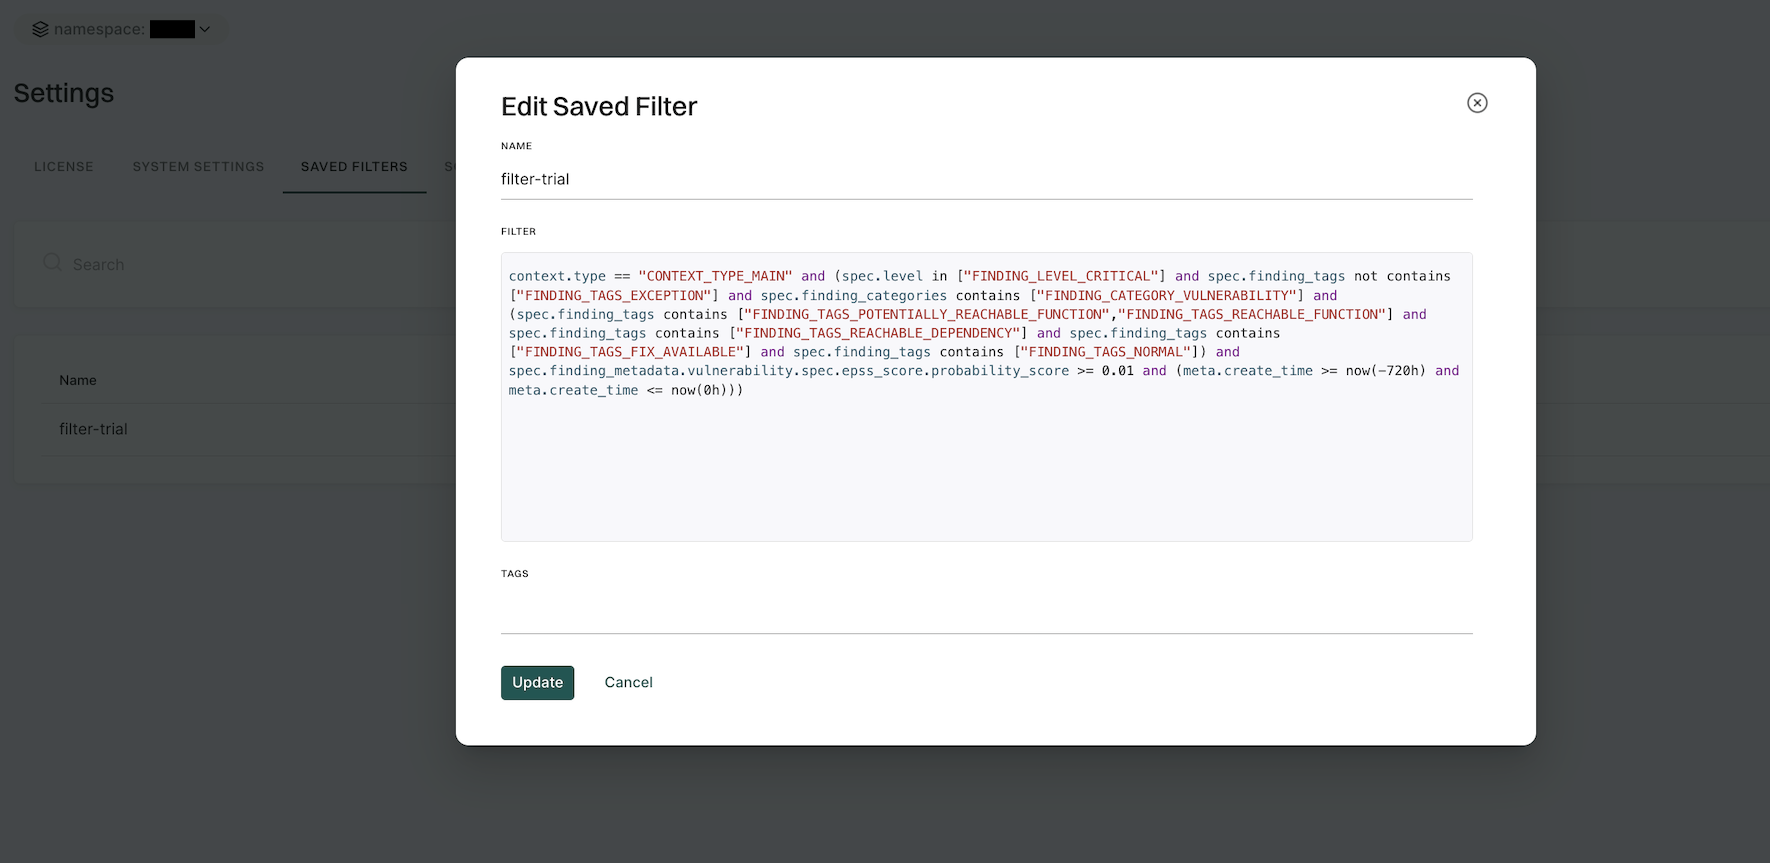
Manage saved filters
To delete a saved filter:
Select Settings from the left sidebar.
Select SAVED FILTERS.
Click the vertical three dots on the right side of the filter you want to delete and click Delete.
To edit a saved filter:
Select Settings from the left sidebar.
Select SAVED FILTERS.
Click the vertical three dots on the right side of the filter you want to edit and click Edit
You can update the name, query, and tags.
Click Update to save the updated changes.
Search for exceptions
Findings that are associated with exception policies do not trigger notifications.
To search for findings that are associated with exceptions,
Select Projects from the left sidebar.
Search for and select a project, and select Findings.
Click Exceptions and select Yes.
Use the filter form to refine results by exception policy name, reason, or expiry range.
Note
You can edit the exception policy name from the findings detail drawer if you have admin permissions. This change updates the exception policy name for all findings that reference it.
See Action policies for details on how to define and trigger workflows based on findings that meet a given set of criteria.
Export findings
Users can export finding details to a CSV file for offline analysis.
Select Projects from the left sidebar.
Search for and select a project and select Findings.
Search for findings using advanced or basic filters.
Select the findings and click the vertical three dots.
Choose Export Selected or Export All and select the fields that you want to include in the CSV file.
Click Export to CSV.
The file is downloaded to your system.
Apply tags to findings
Tagging findings helps you organize, prioritize, and filter issues efficiently. You can tag findings in a finding policy or while running the endorctl scan.
Using finding policies
You can define custom tags in a finding policy, which automatically apply to findings that match its conditions. See Finding policies for more information.
To add custom tags:
Select Policies & Rules from the left sidebar.
Follow the steps to create a finding policy. Ensure to add your choice of custom tags in Finding Custom Tags. You can also update an existing policy.
Click Create Finding Policy.
After you create or update a finding policy, rescan your project to apply the custom tags to your findings.
Through the CLI
When scanning projects using endorctl, you can tag all the findings generated within the scan scope using the --finding-tags flag.
To scan and tag all findings of a endorctl scan:
endorctl scan --finding-tags=findings-tag-name
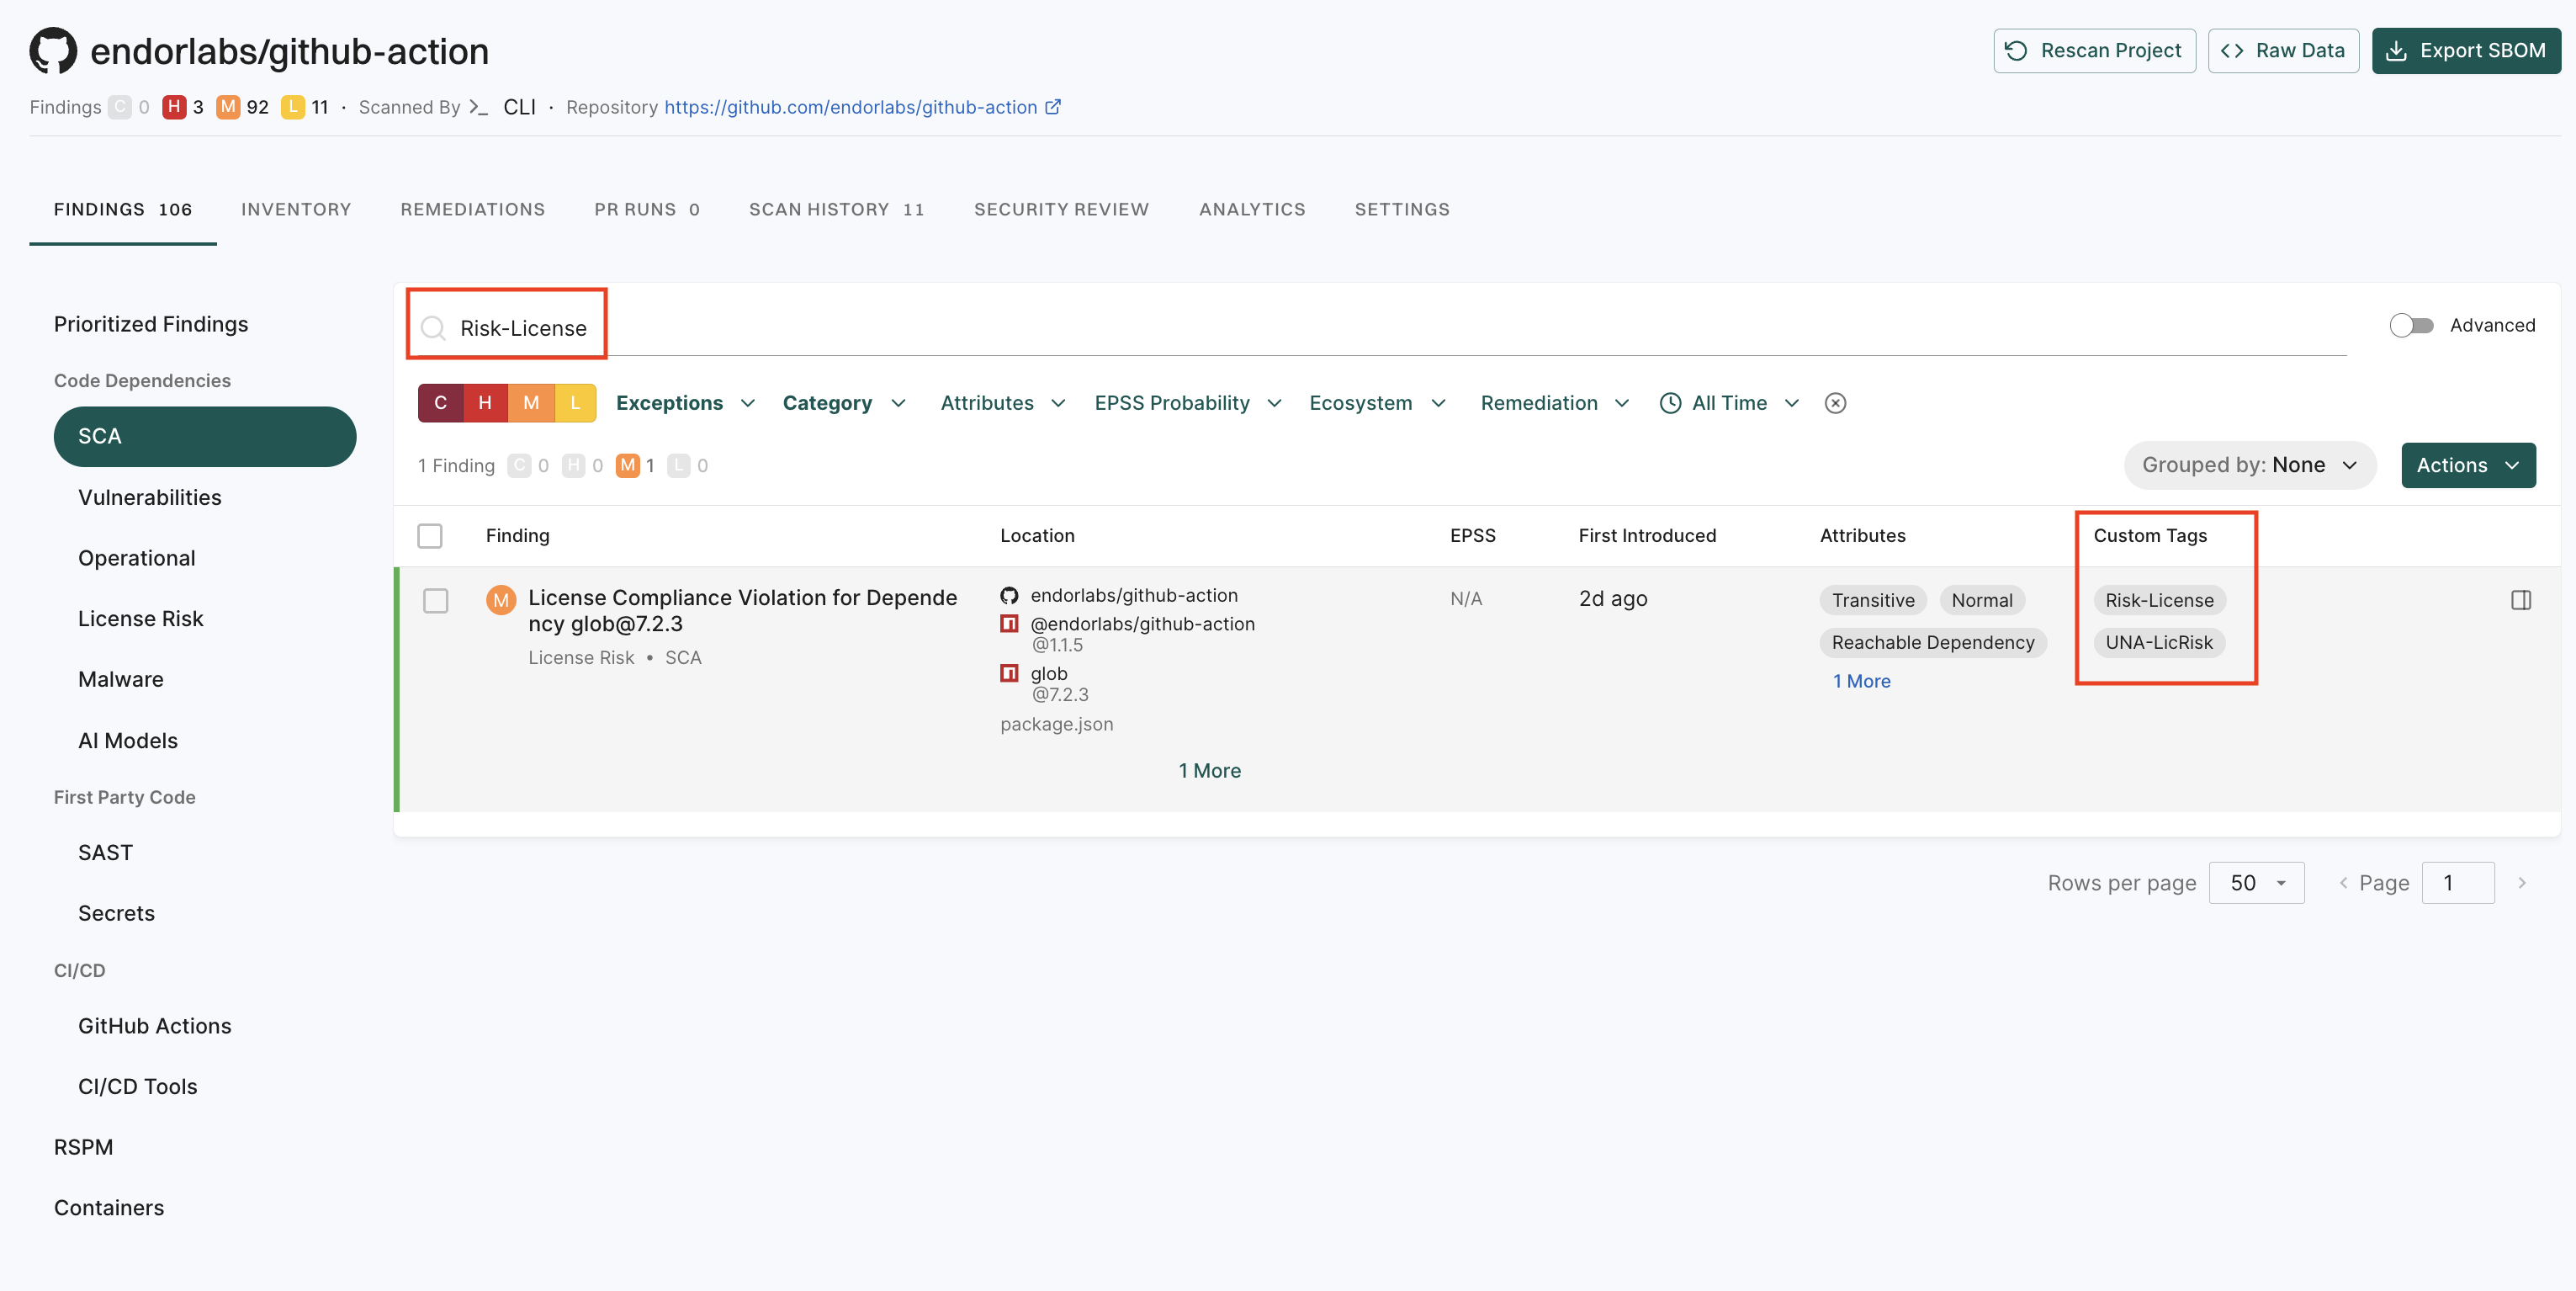
View tagged findings
To filter and view the findings by their tags:
Select Projects > Findings from the left sidebar.
Enter the tag in the search bar to filter and view findings by tag name.
View Remediations
If you enable upgrade impact analysis, you can view the remediation recommendation when you select a finding, if available.
Click View Full Recommendation to view all available upgrade paths.
Packages
Packages are collections of generally related software functions, which are built in a repository.
A package generally may have any of the following:
Versions - A point in time in the software development lifecycle of a given package’s source code. Versions may be named and published versions as well as versions based on the version of the repository.
Dependencies - Other software package versions that a given software package depends on.
Dependents - Other software package versions that depend on one or more versions of a given software package.
Findings - A finding is a discovery of interest derived from an evaluation. Findings are default out-of-the-box implementation of rule sets. Policy for these rule sets is coming soon.
Scorecards - Scorecards are data sheets of facts that are used to derive Endor Labs scores. Scorecards are based on analysis that Endor Labs performs on open-source dependencies used in your packages.
Package dependencies and dependents
Package dependencies are versions of other software packages your software relies on to deliver its functionality. Inversely, dependents are those package versions that depend on a specific package that you’ve created in one of your projects.
Endor Labs builds a bill of materials for each of your package dependencies. Package dependencies and dependents may be direct or transitive:
Direct package dependencies are those package versions that are explicitly defined and imported into a package’s declaration file.
Transitive package dependencies are those package versions that are pulled into a package because of their use in a direct dependency.
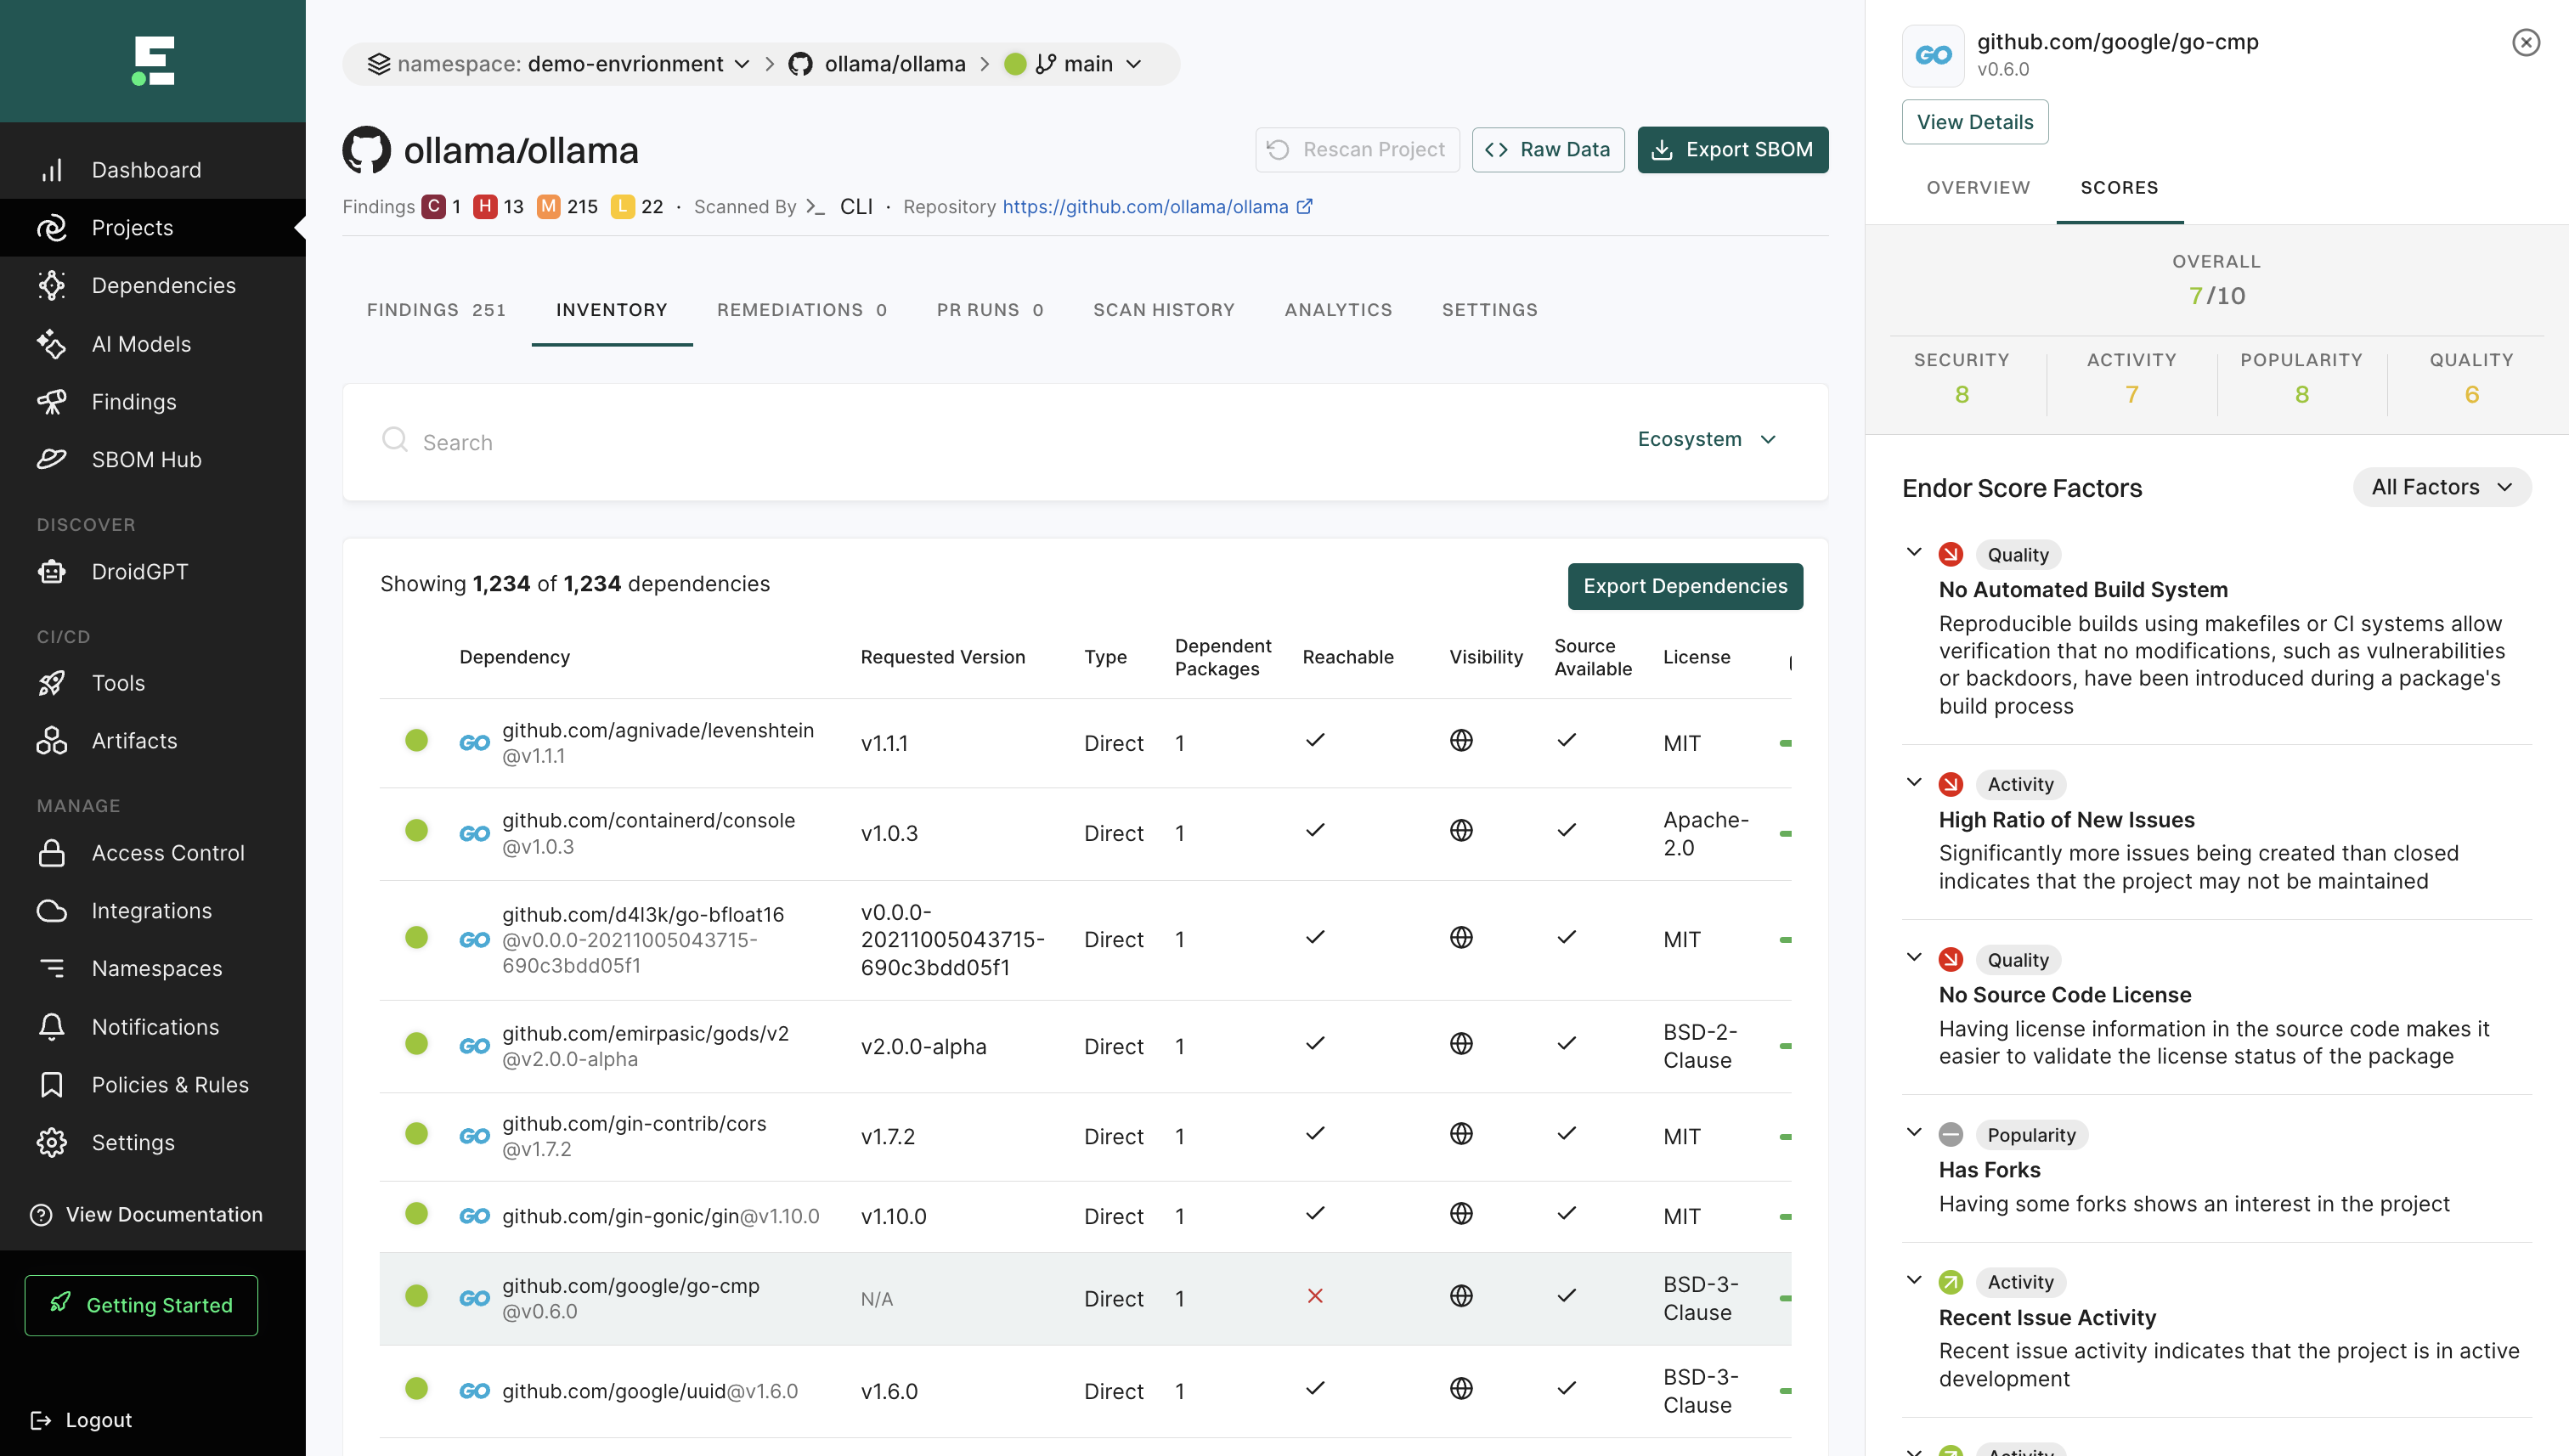
Dependency Metadata
A dependency of a given package version has the following metadata associated with it directly in the table of dependencies:
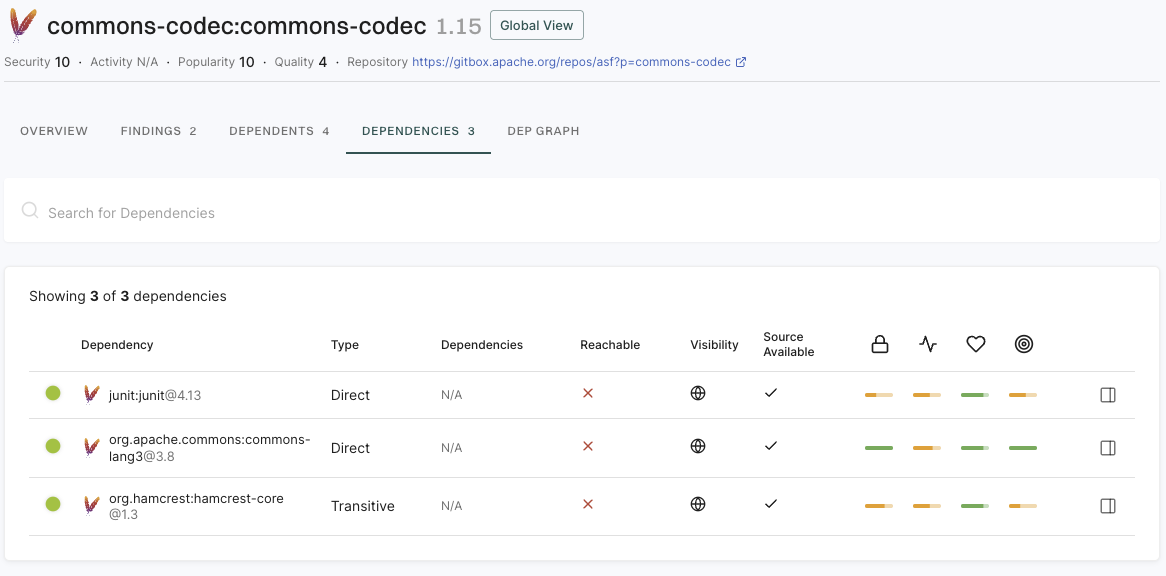
Dependency Name and Version - The name and version of the dependencies your project or package relies on.
Type - If a dependency is directly imported as part of a package, it is of type Direct. If a dependency is imported through the import of one or more direct dependencies, it is of type Transitive.
Dependent Packages - In the context of a project, dependent packages are the number of packages created by the project that rely on your package.
Reachability - A dependencies reachability status may have three states:
Reachable - A dependency is flagged as reachable when a call graph of the dependency is able to reach the dependency as it traverses the function calls made by a package.
Unreachable - A dependency is flagged as unreachable when a call graph of the dependency is NOT able to reach the dependency as it traverses the function calls made by a package.
Potentially Reachable - A dependency is flagged as potentially reachable when call graph analysis is unsupported for a given language/package manager or has failed and is unable to determine if a dependency may or may not be reachable.
Visibility - If a dependency is publicly available for use it is flagged as public. Otherwise, if a dependency is from a private package it is flagged as private.
Source Available - If the source code is auditable and directly linked with the metadata of a package then the source code is flagged as available. For dependencies where source code is unavailable, an Endor Labs scorecard is not generated for the dependency.
Endor Labs Dependency Scorecard - Scorecards are data sheets of facts that are used to derive Endor Labs scores. Endor Labs creates a scorecard for the security, activity, popularity and quality of a software dependency.
In addition, if you click on a given dependency a drawer with additional data points is made available to users.
Dependency Paths - Dependency Paths show how a given version of a dependency is imported into a package. This may be used to understand the effort to update a dependency and to get visibility into how deeply embedded a dependency is in your ecosystem.
Dependency Specification - A dependency’s specification documents the request made for a given dependency when that dependency is directly imported into a package. This helps organizations to understand if that dependency is only a test and any metadata associated with the dependency’s import.
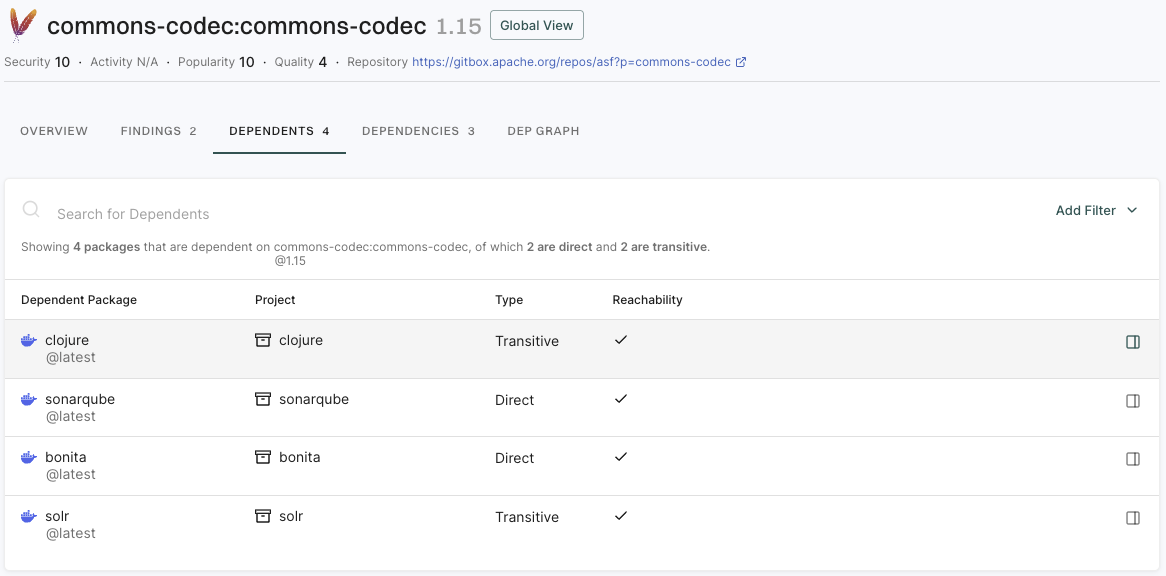
Dependent Metadata
A dependent of a given package version has the following metadata associated with it directly in the table of dependents.
Dependent Package Name - The name of a package that is dependent on the package you are reviewing or that is created within the context of the project you are reviewing.
Dependent Package Version - The version of a package that is dependent on the package you are reviewing or that is created within the context of the project you are reviewing.
Repository of dependent package - The location from which the package that depends on the package you are reviewing is being developed.
View package dependencies and dependents
To view the dependencies of your package:
Select Projects from the left sidebar.
Search for and select a project to review.
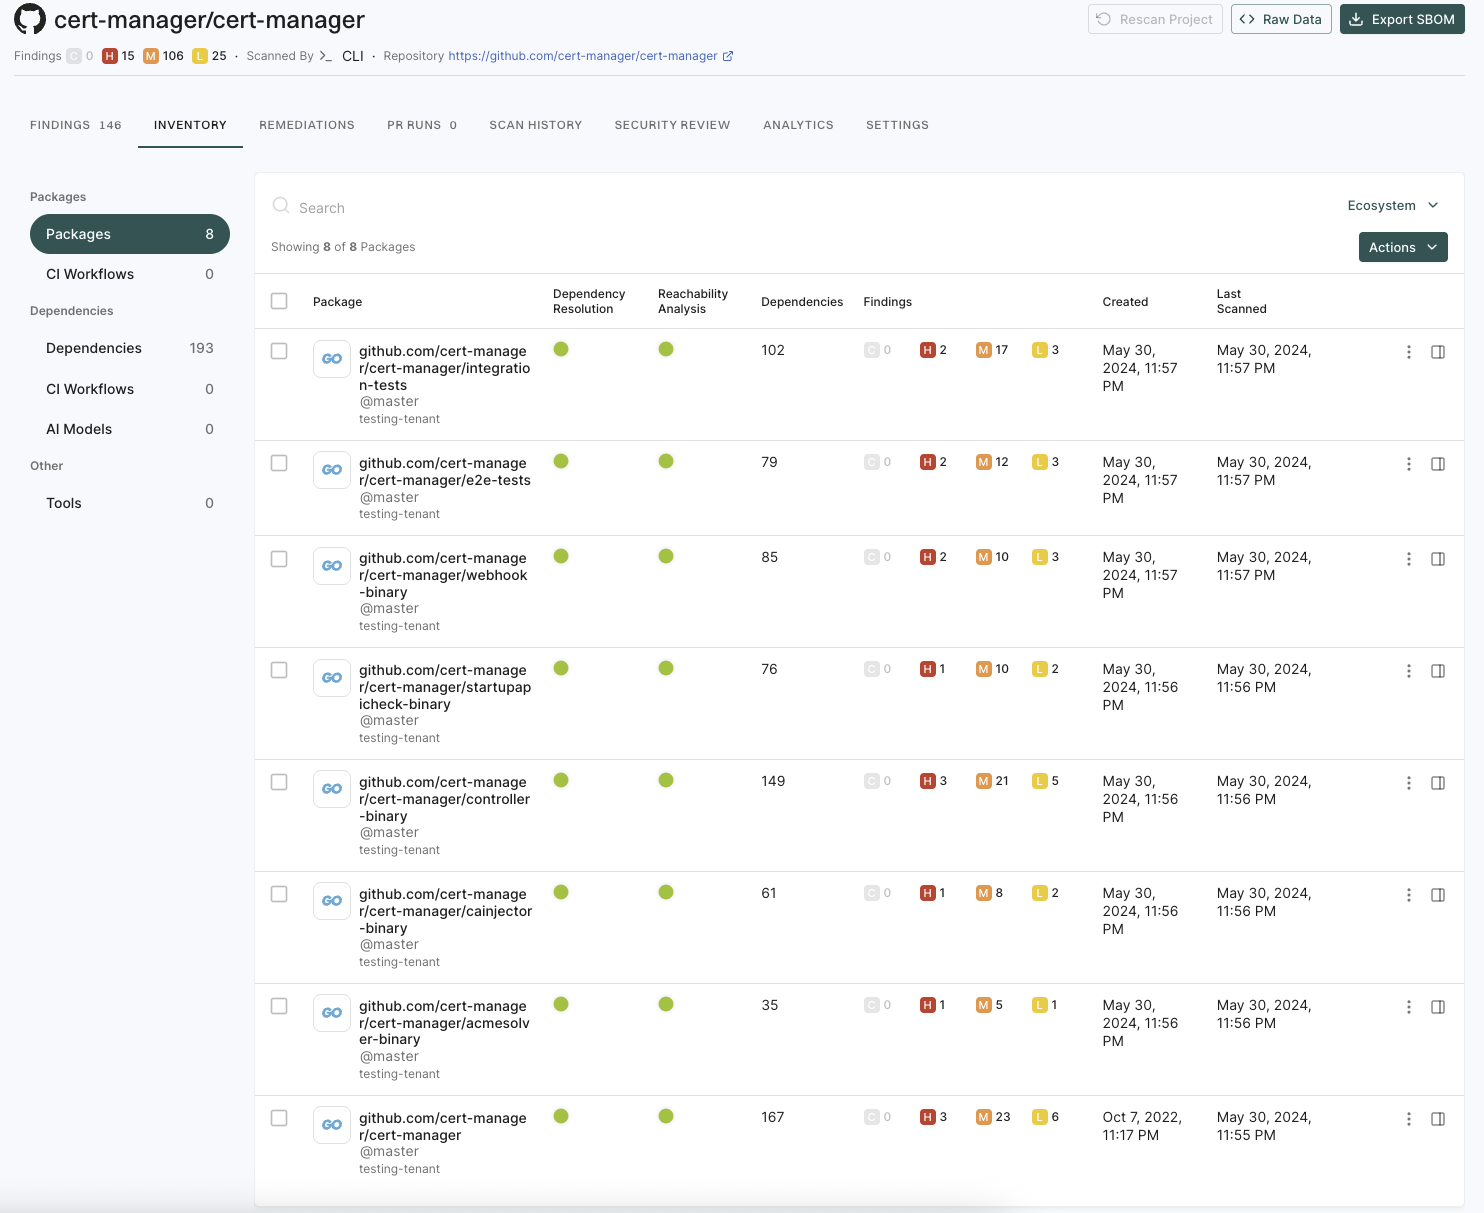
Go to Packages under Inventory to view the list of all packages maintained as part of your project and any findings associated with them.
You can view the following details of the packages in the project.
Package Name - The name of the package along with the icon of the package manager.
Dependency Resolution - Status icon that shows whether dependency resolution was successful.
Reachability Analysis - Status icon that shows whether reachability analysis was successful.
Dependencies - The number of dependencies of the package.
Findings - The number of findings associated with the package.
Created - The date and time when the package was created.
Last Scanned - The date and time when the package was last scanned.
Important
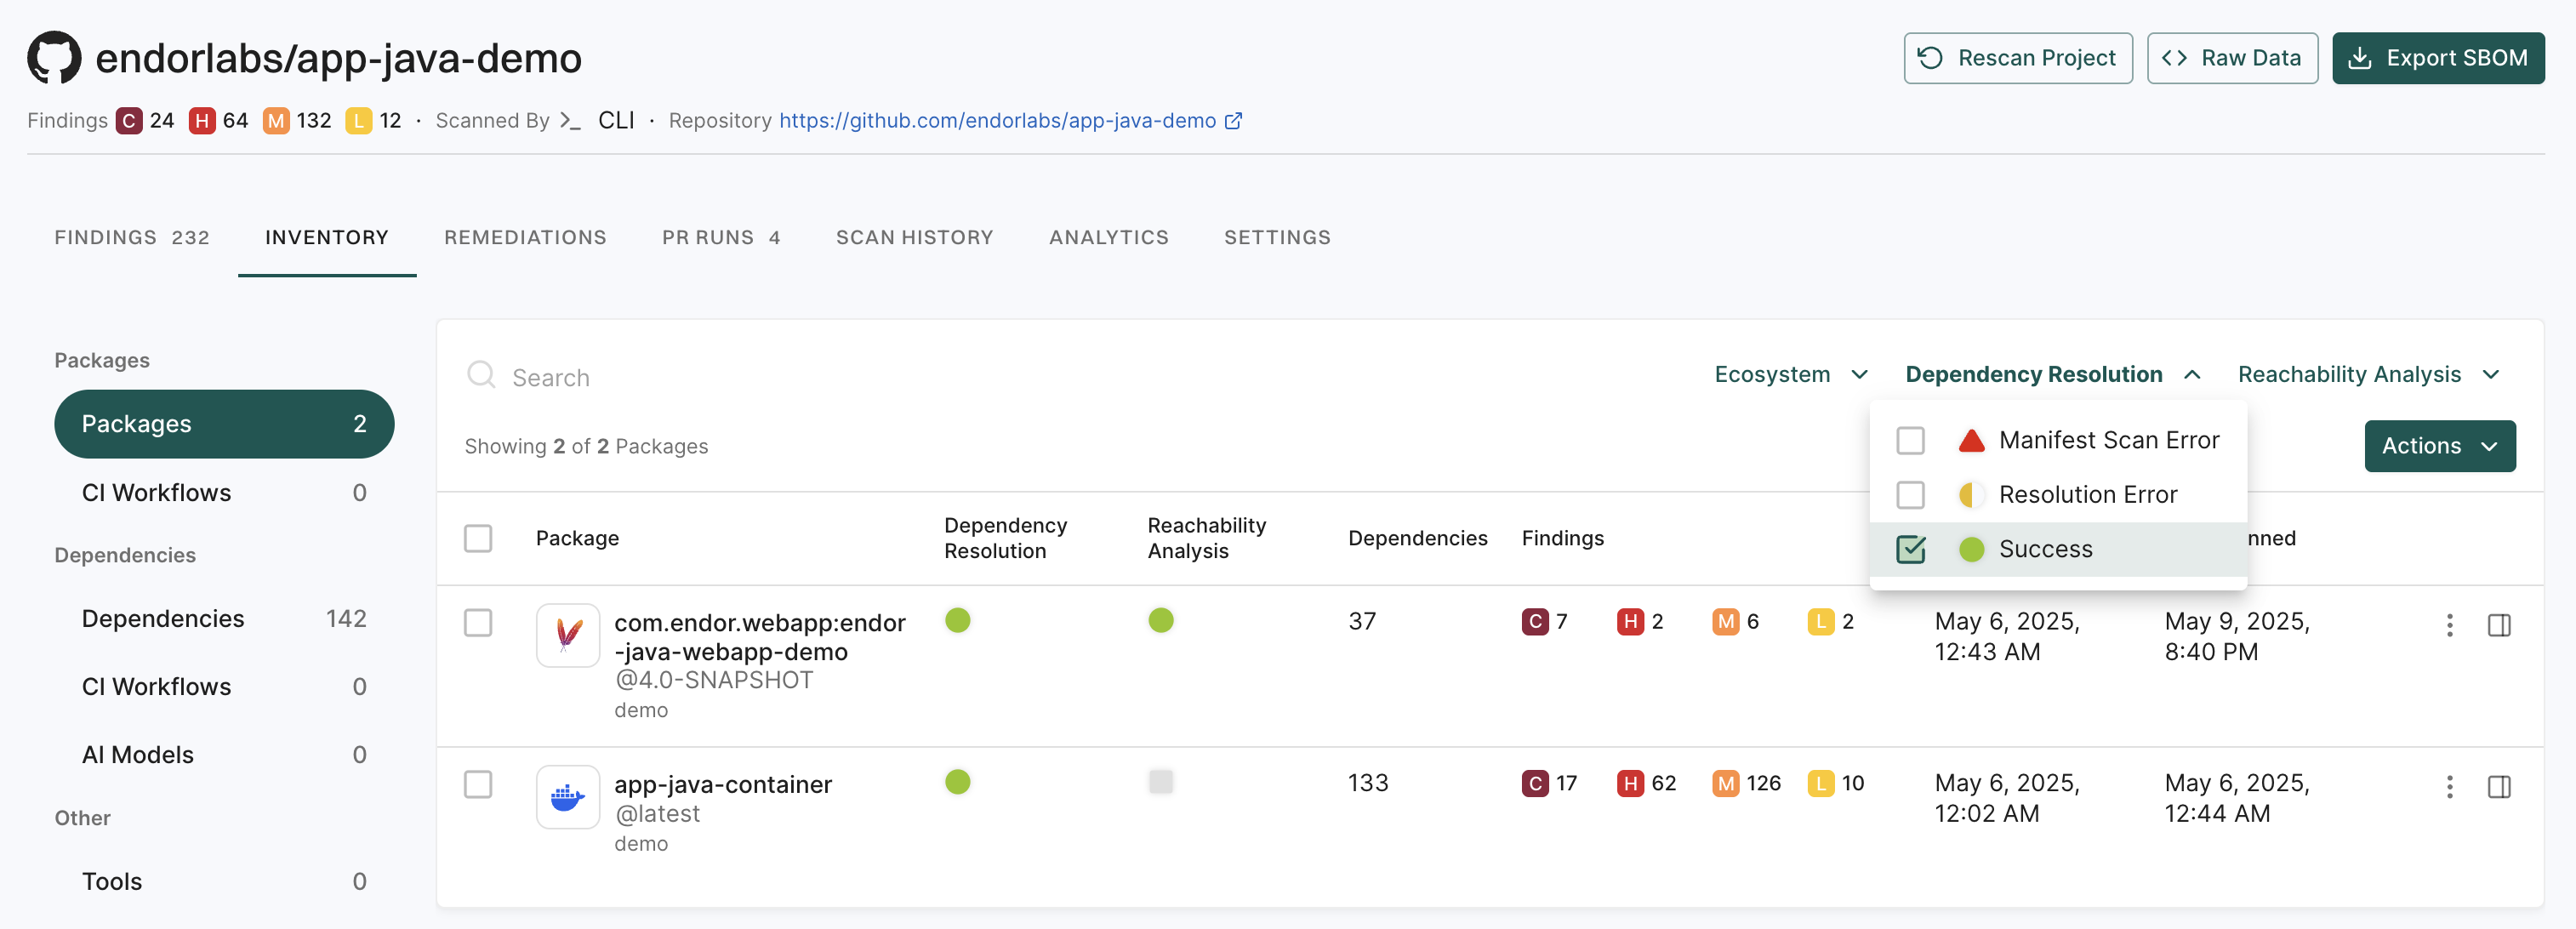
The following table describes the status icons for dependency resolution.
Status
Description
▲
Error occurred during manifest scan
◐
Error occurred during dependency resolution
●
Dependency resolution was successful
The following table describes the status icons for reachability analysis.
Status
Description
▲
Error occurred during call graph generation
●
Call graph generation was successful
■
Call graph generation is not supported or not enabled
Click the package to view all dependencies and the scorecards of those dependencies.
To view the dependencies of your package:
Select Projects from the left sidebar.
Search for and select a project to review.
Go to Packages under Inventory to view the list of all packages maintained as part of your project and any findings associated with them.
Select the package whose dependents you’d like to review.
Select Dependencies to see dependencies associated with your packages.
Dependents can be used to communicate with downstream users of your package version regarding any major modifications to your package.
Filter package dependencies
Use filters to focus on the packages that are relevant to your tech stack and quickly identify resolution or reachability issues.
Select Projects from the left sidebar.
Search for and select a project to review.
Go to Packages under Inventory to view the list of all packages maintained as part of your project and any findings associated with them.
Use the Ecosystem, Dependency Resolution, and Reachability Analysis statuses filters to narrow down the results.
You can sort the search results by the Package name, Created data, and Last Scanned date to organize dependencies alphabetically or by timeline, making it easier to review recent changes or locate specific packages.
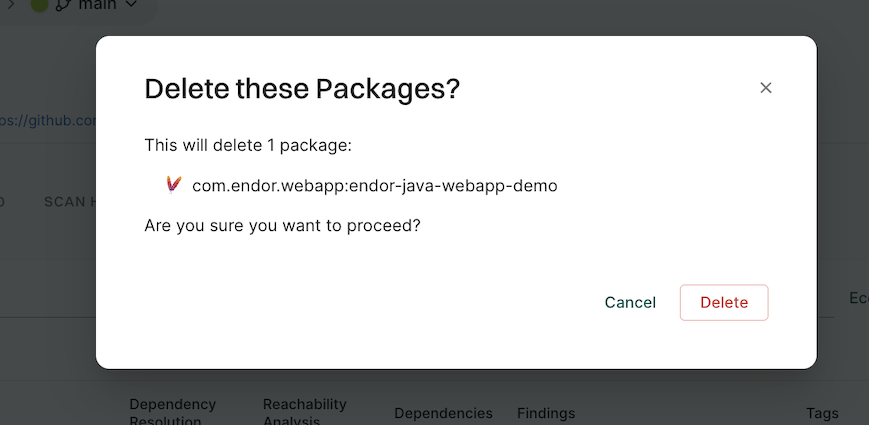
Delete package dependencies
You can delete packages that are no longer needed from your project inventory. Deleting a package also deletes all associated findings.
Select Projects from the left sidebar.
Search for and select a project to review.
Go to Packages under Inventory to view the list of all packages maintained as part of your project and any findings associated with them.
Click the vertical three dots in the package row, select Delete.
Click Delete to confirm the action.
View scorecards
Scorecards are data sheets of facts that are used to derive Endor Labs scores. Scorecards are based on analysis that Endor Labs performs on open-source dependencies used in your packages.
Select Projects from the left sidebar.
Search for and select a project to review.
Go to Packages under Inventory to view the list of all packages maintained as part of your project and any findings associated with them.
Select the package whose dependencies you’d like to review.
Under Dependency, you can see the scores for Quality, Activity, Security, and Popularity. Click on any of these scores to view the scorecard of the dependency.
Scorecards show the results of the analysis from which Endor Labs scores are derived. Review the scorecard to learn more about your dependency. See also Understand Endor scores.
Dashboards
Dashboards offer a concise and visual way to monitor the security posture of the projects in your organization. They are interactive and help you visualize how you use your projects, packages, and dependencies.
Dashboards provide the following capabilities to monitor potential threats:
Gain real-time insights across your code inventory through a range of system widgets that display information in the form of bar graphs.
Aggregate and analyze findings, vulnerabilities, and dependencies using visual metrics for a clearer understanding.
Monitor most used or least used dependencies through real-time visibility and updates.
Understand how Endor patches can help you remediate your findings.
Track security metrics, vulnerability trends, and resolution times across projects.
Visualize the vulnerabilities in your codebase from a SAST and secrets perspective.
Endor Labs comes with several out-of-the-box widgets to enable teams to understand potential risks and take preventive measures.
Widgets in the Endor Labs dashboards consolidate related data of a single type, providing valuable information.
Use the widgets in OSS overview dashboard to understand various aspects of your codebase, dependencies, vulnerabilities, and overall software security posture.
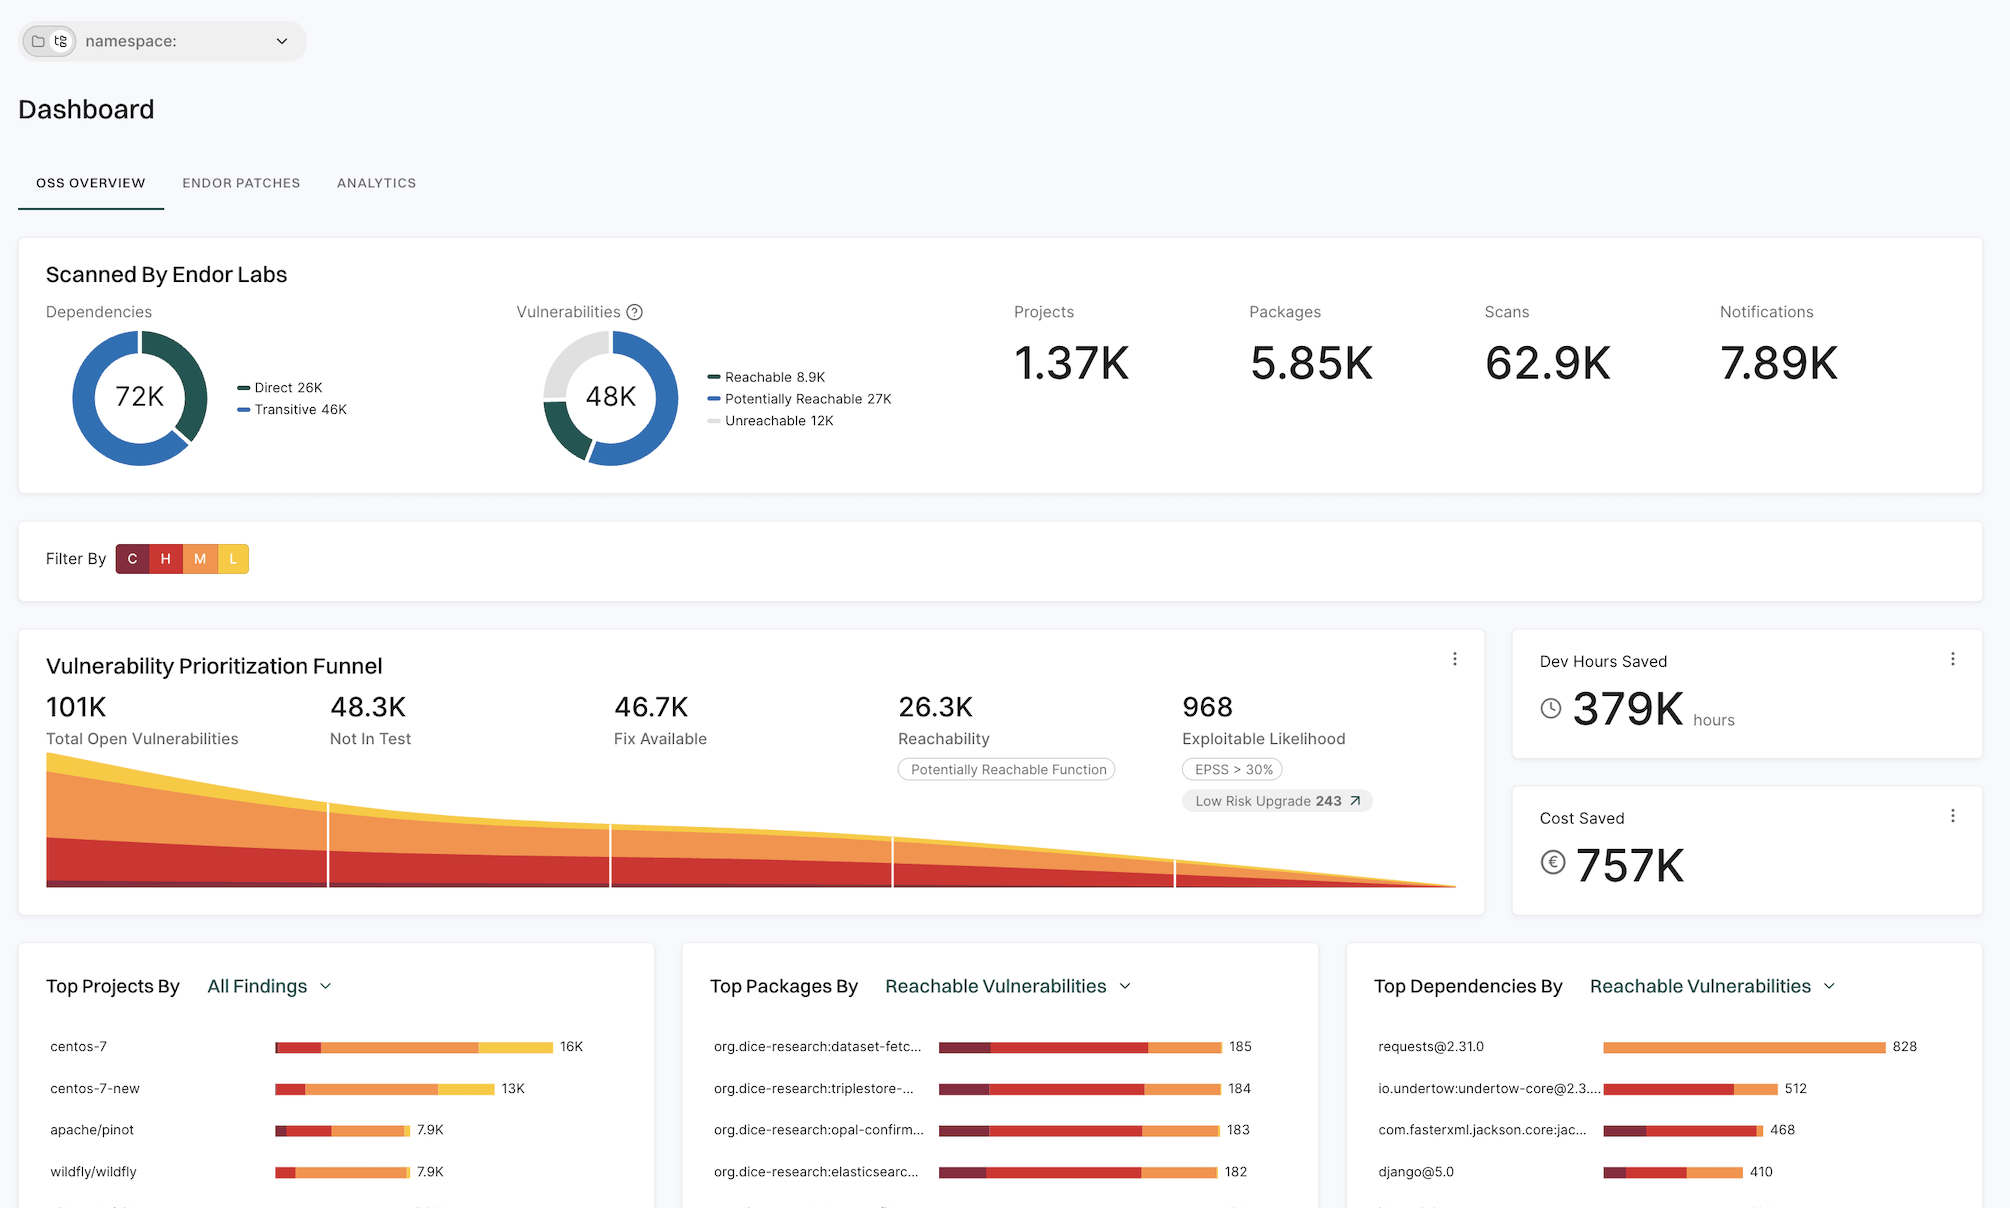
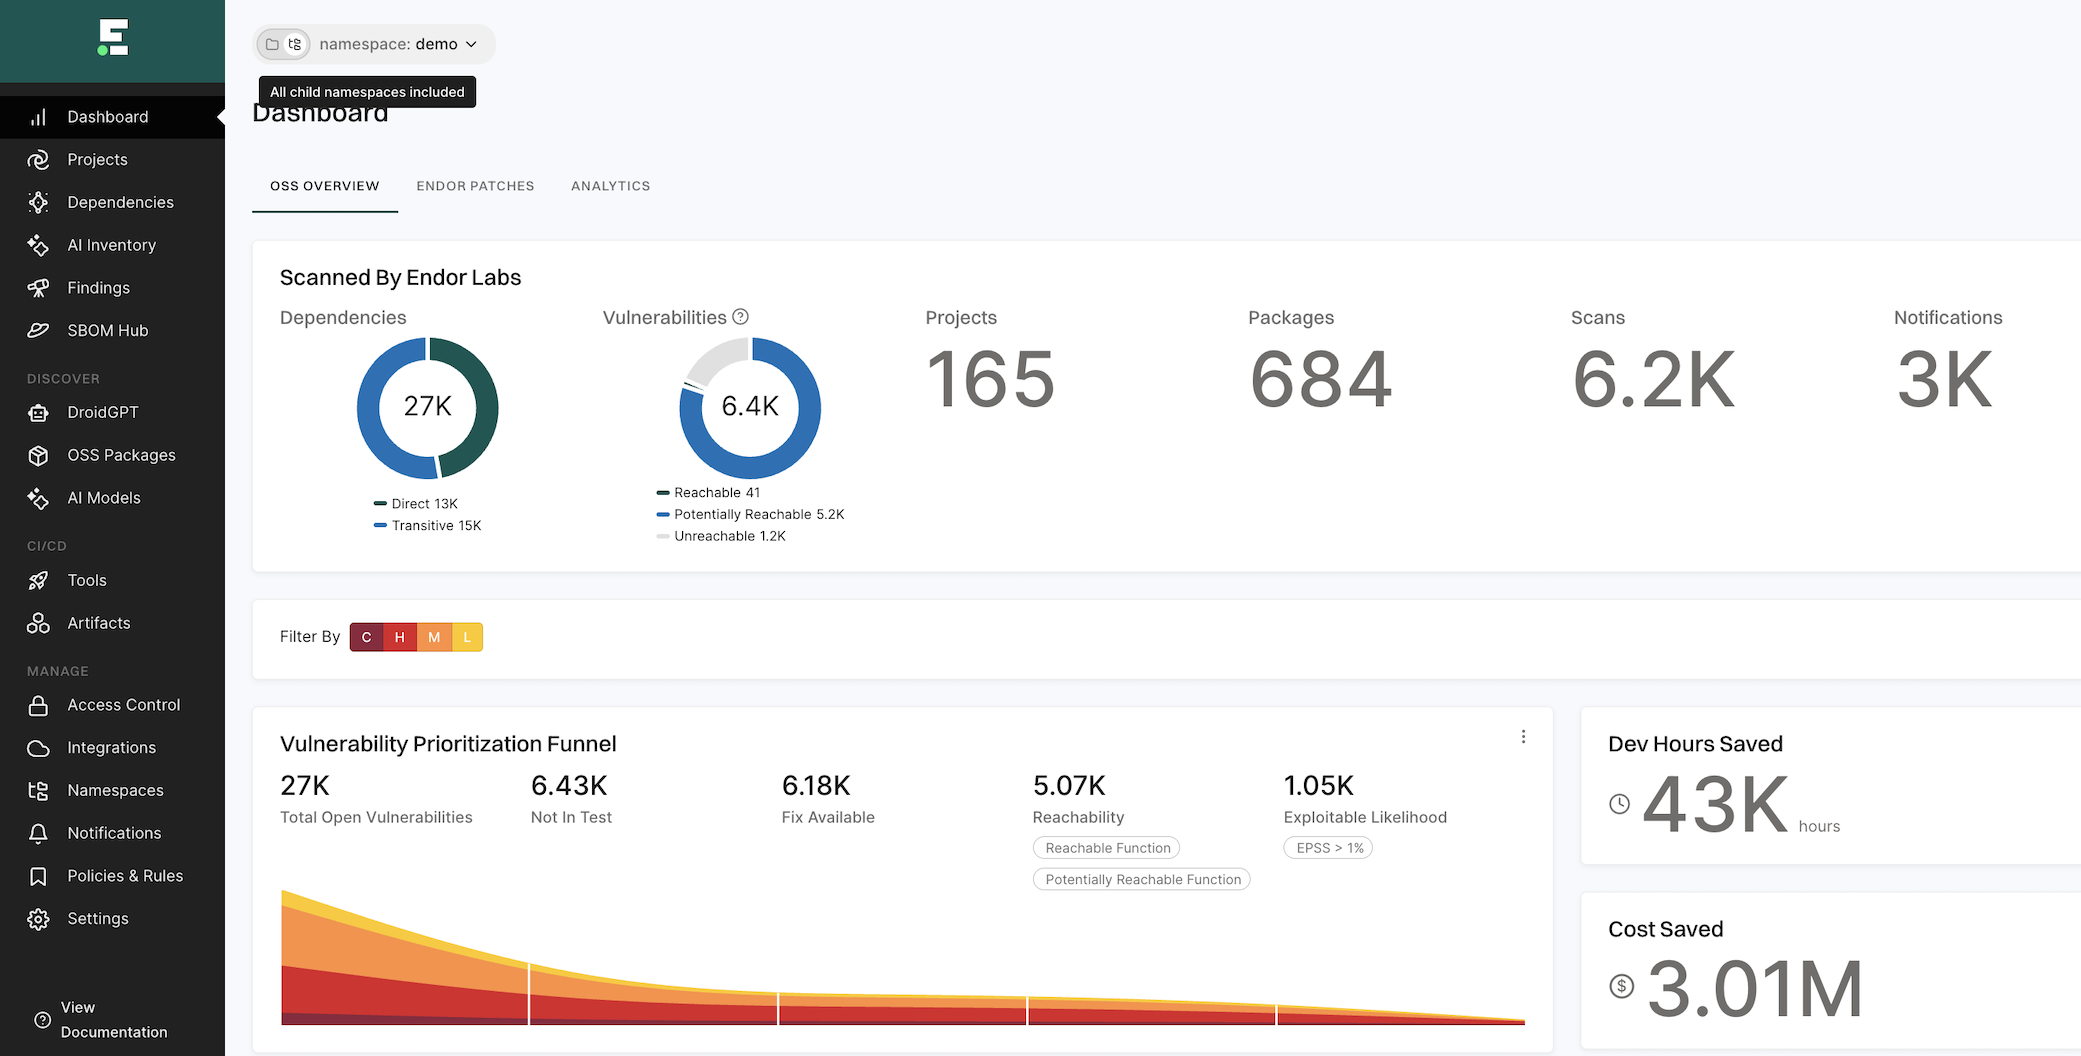
Scanned by Endor Labs
Displays information on the following scan statistics across all ecosystems in the given tenant:
Total number of dependencies, categorized into direct and transitive dependencies
Total number of vulnerabilities, categorized into unreachable and other vulnerabilities
Total number of projects
total number of packages
Total number of scans
Total number of configured notifications
Vulnerability prioritization funnel
Endor Labs’ vulnerability prioritization funnel systematically assesses and categorizes vulnerabilities based on their severity and category. The vulnerabilities are prioritized in the following order:
Total open vulnerabilities - Indicates the complete list of vulnerabilities detected in all the scanned projects in this tenant.
Not in test - Indicates the list of vulnerabilities that are present in the production code and not in the test code.
Fix available - Indicates the list of vulnerabilities in the production code, for which a fix is available.
Reachable - Indicates the list of vulnerabilities in production code, with a fix, that can be accessed or exploited. Customize the reachable findings for your organization. You choose to see the data for reachable functions or potentially reachable functions, or for both. See Customize finding reachability.
Exploitable likelihood - Indicates the list of vulnerabilities in production code, with a fix, that are reachable, and with an EPSS probability score greater than 1%.
Click Low Risk Upgrades in the vulnerability prioritization funnel to view findings with low remediation risk, if present in your namespace.
Use the search bar to filter projects by name and view their OSS overview. The search supports partial matching. For example, when you search repo, the system displays all projects containing repo in their title along with their corresponding OSS overview data.
Note
You require an Endor Labs OSS Pro license to access the Low Risk Upgrade feature.
By applying this funnel approach, organizations can prioritize addressing the most critical, exploitable, and actionable vulnerabilities first, maximizing their security efforts.
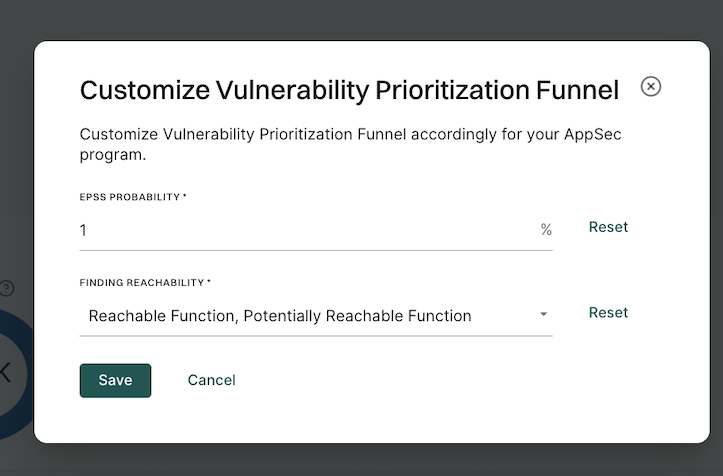
Customize finding reachability
Customize finding reachability for your organization. The data in the Vulnerability Prioritization Funnel
Sign in to Endor Labs and click Dashboard.
Navigate to the Vulnerability Prioritization Funnel and click the vertical three dots.
In FINDING REACHABILITY, define your finding reachability criteria.
You can select Reachable Function, Potentially Reachable Function, both options, or neither.
Click Save.
Click Reset to restore finding reachability to your last set values.
Development hours and cost saved
Visualize the hours and cost saved metrics information on the dashboard.
Dev Hours Saved - Development hours saved is an estimate that is calculated after reducing the number of vulnerabilities that developers must prioritize. See Customize development hours.
Cost Saved - Cost savings is an estimate that is made by multiplying the saved developer hours with the full-time equivalent (FTE) hourly cost for triaging vulnerabilities. See Customize cost baseline.
Customize baseline for development hours
Adjust the development baseline to meet your organization’s specific needs.
Sign in to Endor Labs and click Dashboard.
Navigate to the Dev Hours Saved and click the vertical ellipsis.
Choose BASELINE and set DEV HOURS for a record on the Vulnerability Prioritization Funnel,
Total Open Vulnerabilities - Provide approximate development hours required to triage all open vulnerabilities. By default, the development hours saved are calculated based on this baseline and displayed on the Vulnerability Prioritization Funnel.
Not In Test - Provide approximate development hours required to triage vulnerabilities in production code.
Reachable - Provide approximate development hours required to triage accessible and most exploitable vulnerabilities.
Fix Available - Provide approximate development hours required to triage vulnerabilities that can be addressed with a patch or an upgrade.
Click Save.
Customize baseline for cost
Tailor the cost baseline to reflect the Full-Time Equivalent cost of your organization.
Sign in to Endor Labs and click Dashboard.
Navigate to Cost Saved and click the vertical ellipsis.
Enter an HOURLY COST and CURRENCY that applies to one full-time employee following your organization’s application security program.
Click Save.
Top projects metrics
View the top project data by all findings, all vulnerabilities, reachable vulnerabilities, outdated dependencies, and unmaintained dependencies. You can identify the numbers for critical, high, medium, and low risk severity findings. Click the bar graph to view complete details.
Top packages metrics
View package data by all findings, all vulnerabilities, reachable vulnerabilities, outdated dependencies, and unmaintained dependencies. You can identify the numbers for critical, high, medium, and low risk severity findings. Click the bar graph to view complete details.
Endor patches
Endor patches dashboard provides you with metrics to understand the impact of using Endor patches and remediating vulnerabilities.
Set the filters
Customize the data displayed on the dashboard by applying specific filters to focus on the most relevant information, enabling better analysis and decision-making.
critical(C) or high(H) priority findings - Customize the displayed data by selecting critical or high priority findings or both.
Reachability - Filter the data by reachable function or reachable dependency.
Select Yes to include reachable function or dependency.
Select No to exclude reachable function or dependency.
Select Potential to include potentially reachable functions or dependencies.
These are global filters and apply to all widgets on this dashboard.
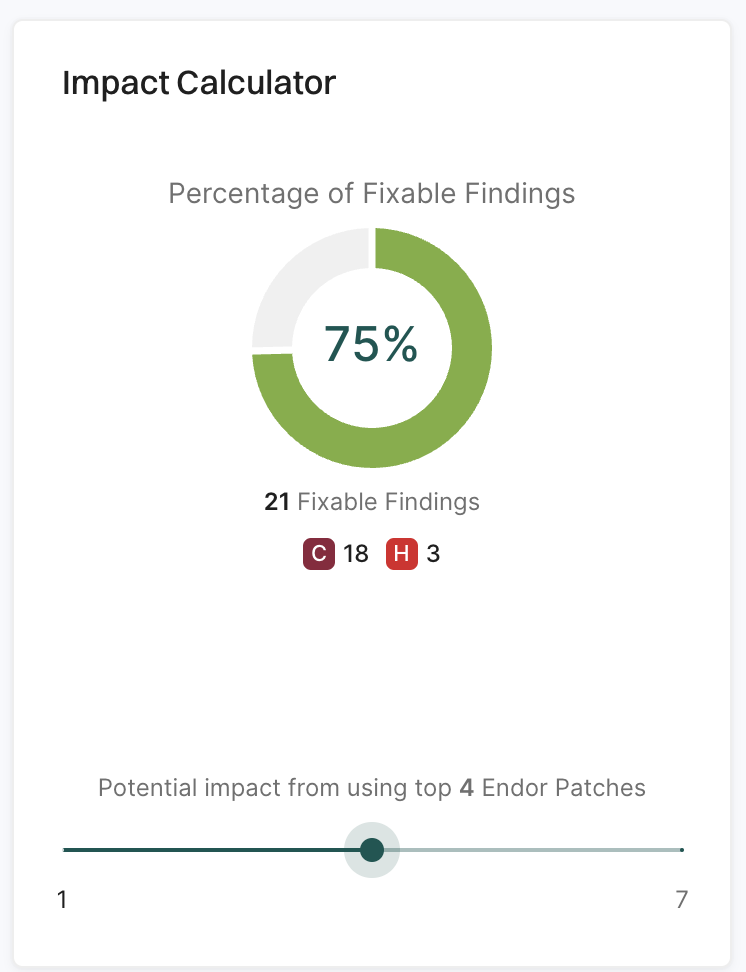
Use impact calculator
Use the impact calculator to see the number of critical and high findings remediated after applying the recommended Endor patches.
View impact of Endor patches
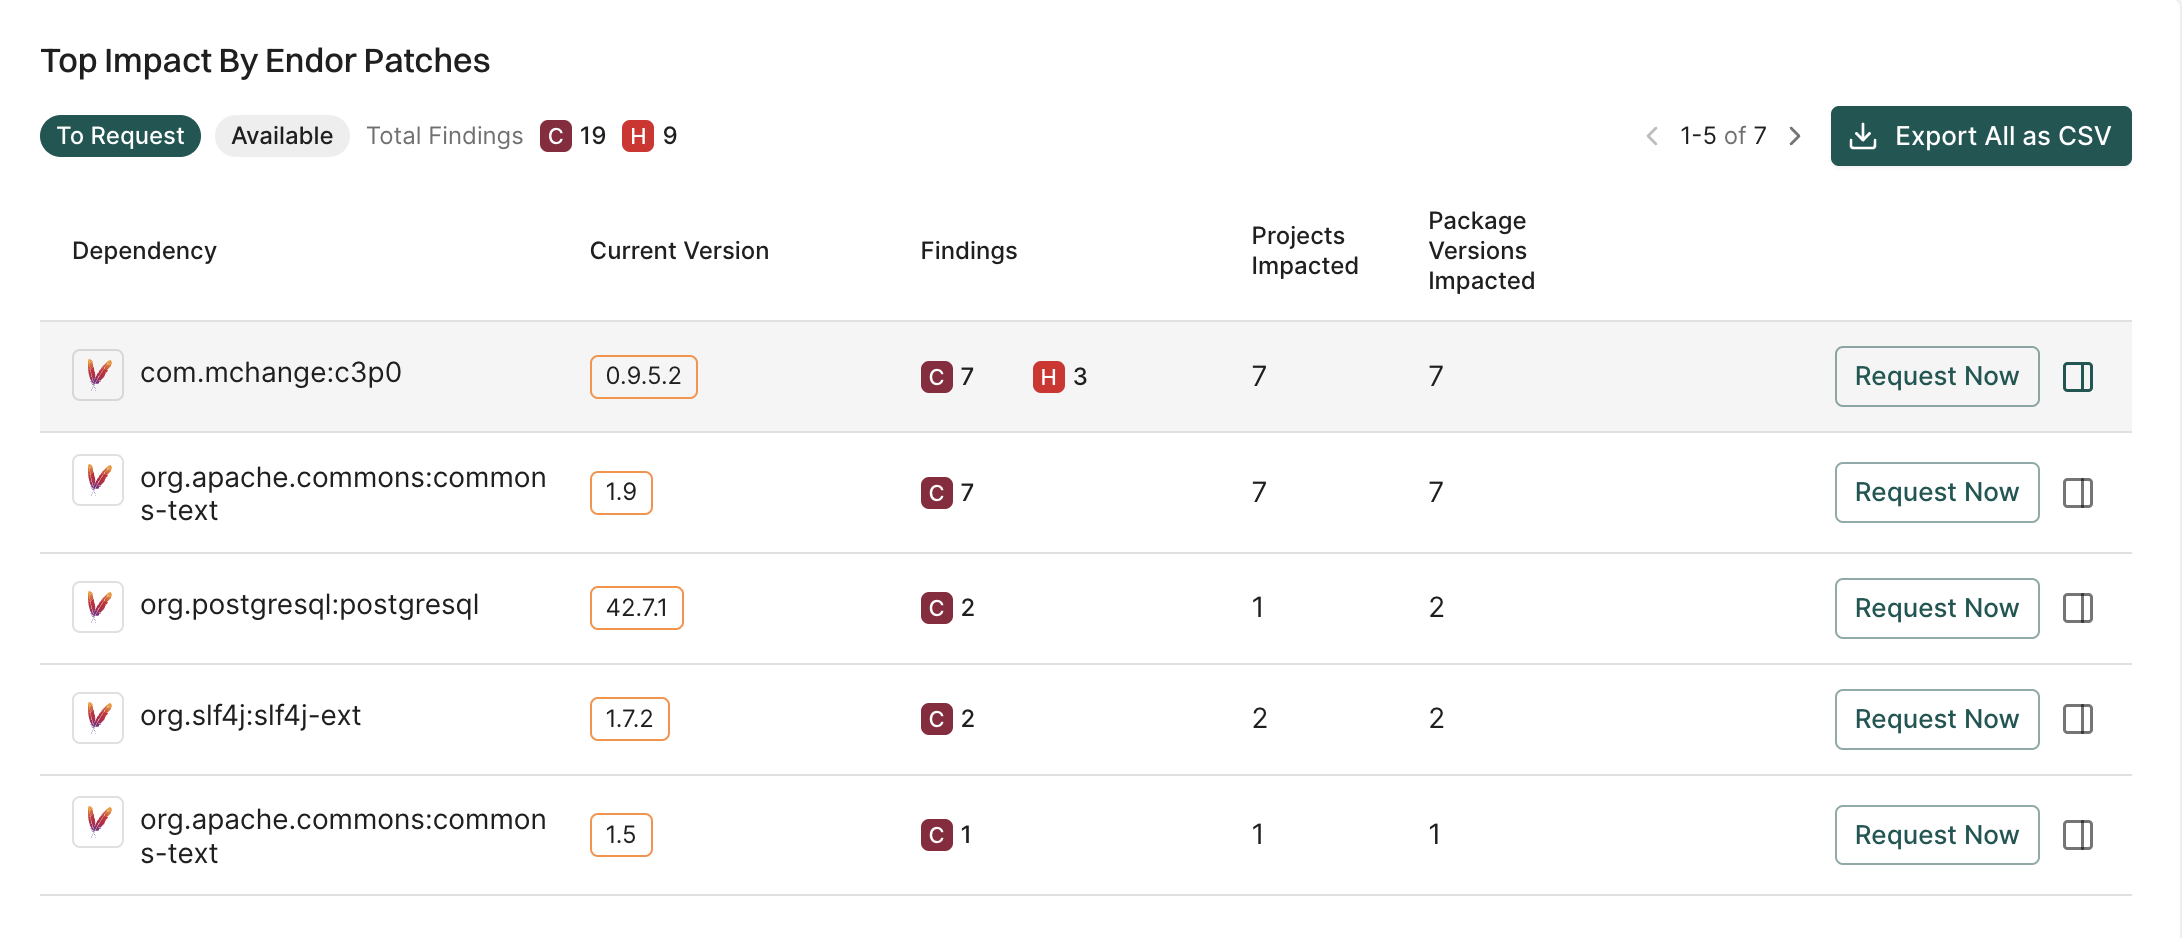
The Top impact By Endor Patches gives you the available Endor patches that you can request.
View the list of dependencies with their current version, findings, projects impacted, and package versions impacted.
Click the drawer on a dependency to view details about the dependency and the list of fixable findings, projects impacted, and package versions impacted.
To export the data in the widget into a CSV file for offline analysis, click Export All as CSV.
To request the Endor patches, click Request Now.
To view the available patches, click Available.
Request for Endor patches
After reviewing the most impactful dependencies that affect your applications, you can choose to request for Endor patches that will remediate your critical and high priority findings.
From the Endor Patches dashboard, navigate to Top Impact By Endor Patches.
Select the patch you want to request and click Request Now.
Enter a comment and click Send Request.
Patch request lifecycle
The patch request lifecycle consists of four stages: Open, In Process, Done, and Won’t Do, each representing a different phase of assessment and development.
Open: Endor Labs is assessing the request’s feasibility.
In Process: The request is actively being developed.
Done: The patch is now available.
Won’t Do: Endor Labs has determined that the request is not feasible.
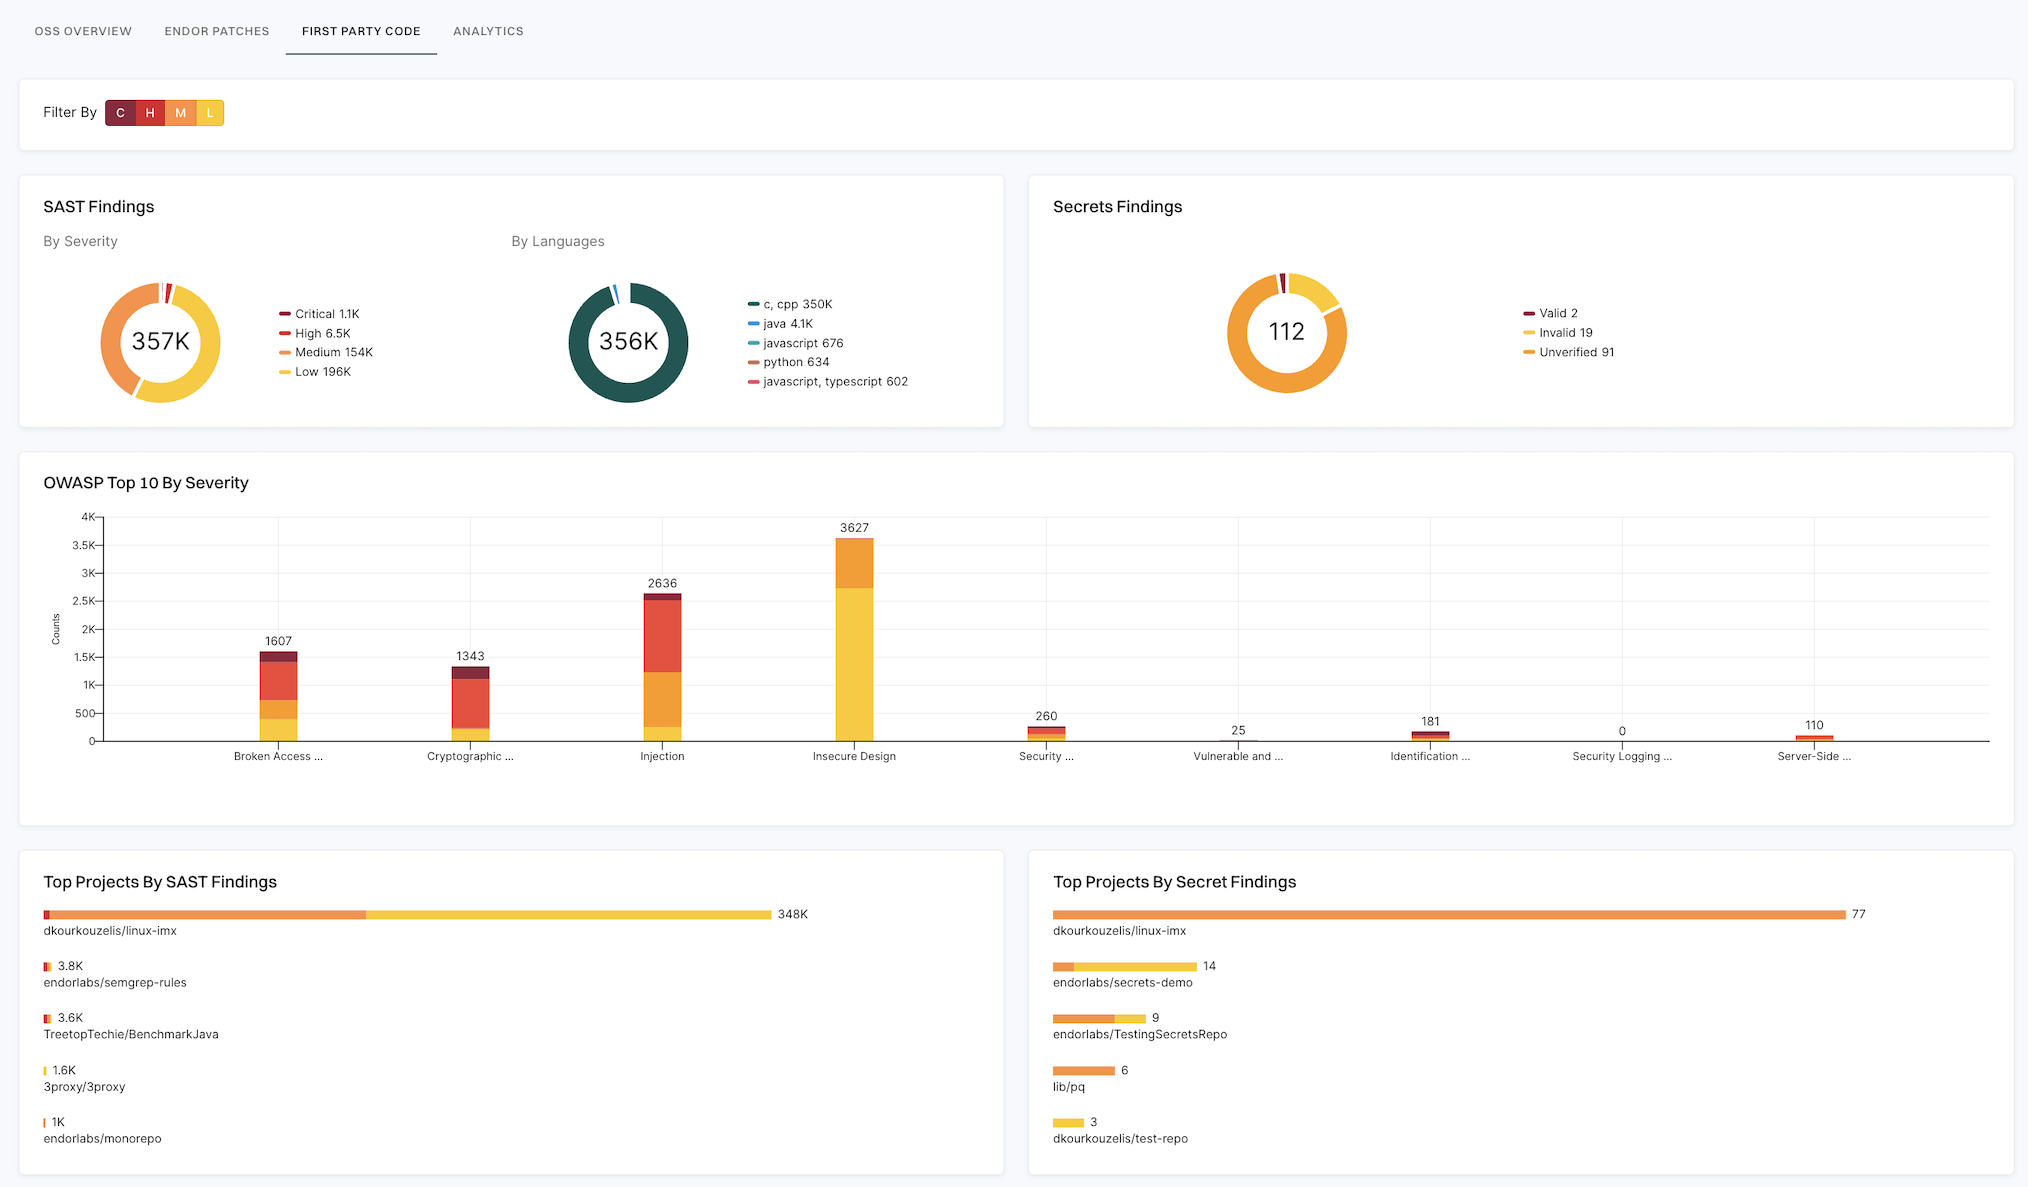
First-party code
Use the widgets in the first-party code dashboard to understand the vulnerabilities in your codebase from a SAST and secrets perspective. Dashboard represents the vulnerabilities across all the projects in the given namespace.
The following sections describe the widgets in the first-party code dashboard and how to use them.
You can filter the data displayed on the dashboard by applying filters based on the severity of the findings. You can choose the combination of critical, high, medium, and low severity findings.
SAST findings
Displays the number of open SAST findings categorized by severity and languages. Click on the severity or language to view the list of specific findings.
Secrets findings
Displays the number of open secrets findings. Valid secrets are critical in nature while invalid secrets are informational in nature with a low severity. The findings are based on the secrets finding policy configured for the projects. Click on the type of secret to view the list of specific findings.
OWASP Top 10 by severity
Displays the number of OWASP Top 10 findings across your projects in a stacked bar chart. Each bar chart represents the OWASP security risk categorized by severity. Click on the bar to view the list of the SAST findings for that risk.
Top 10 secret rules by severity
Displays the number of top 10 secret detection rule findings across your projects in a stacked bar chart. Each bar represents a secret rule categorized by severity. Click on a bar to view the list of findings identified by that secret rule.
Top Projects by SAST findings
Lists the top five projects with the highest number of SAST findings. Click on the project to view the list of SAST findings associated with the project.
Top Projects by secrets findings
Lists the top five projects with the highest number of secrets findings. Click on the project to view the list of findings associated with the project.
Analytics
Analytics dashboard offers a comprehensive view of your security metrics, and tracks finding trends and resolution times across projects. Use it to quickly assess risk levels, monitor progress, and identify areas needing improvement in your security posture.
Set the filters
Customize the data displayed on the Analytics dashboard by applying specific filters to focus on the most relevant information, enabling better analysis and decision-making. Adjusting the filters ensures that you can track progress and identify trends that are critical to your security and development goals.
Tip
These are global filters and apply to all widgets on this dashboard.
Severity - Filter the data based on finding severity such as Critical (C), High (H), Medium (M), or Low (L).
Category - Filter the findings by category such as AI models, vulnerability, SCA, SAST, secrets, and container.
Attributes - Narrow down the list based on a range of factors such as:
if a patch is available to fix the findings
if the vulnerable function is reachable
if the dependency is reachable
if the dependency originates from a current repository or a current tenant
if the dependency is a test dependency
if the dependency is a phantom dependency
if the finding originates from itself, direct, or a transitive dependency
filter the findings by the Exploited tag from CISA KEV
filter the findings by the Warn or Break the Build options set in the action policy
When was the Finding first introduced - Select a time period from the available options to filter the analytics data based on when the finding was first scanned. By default, the data from the last 90 days is displayed.
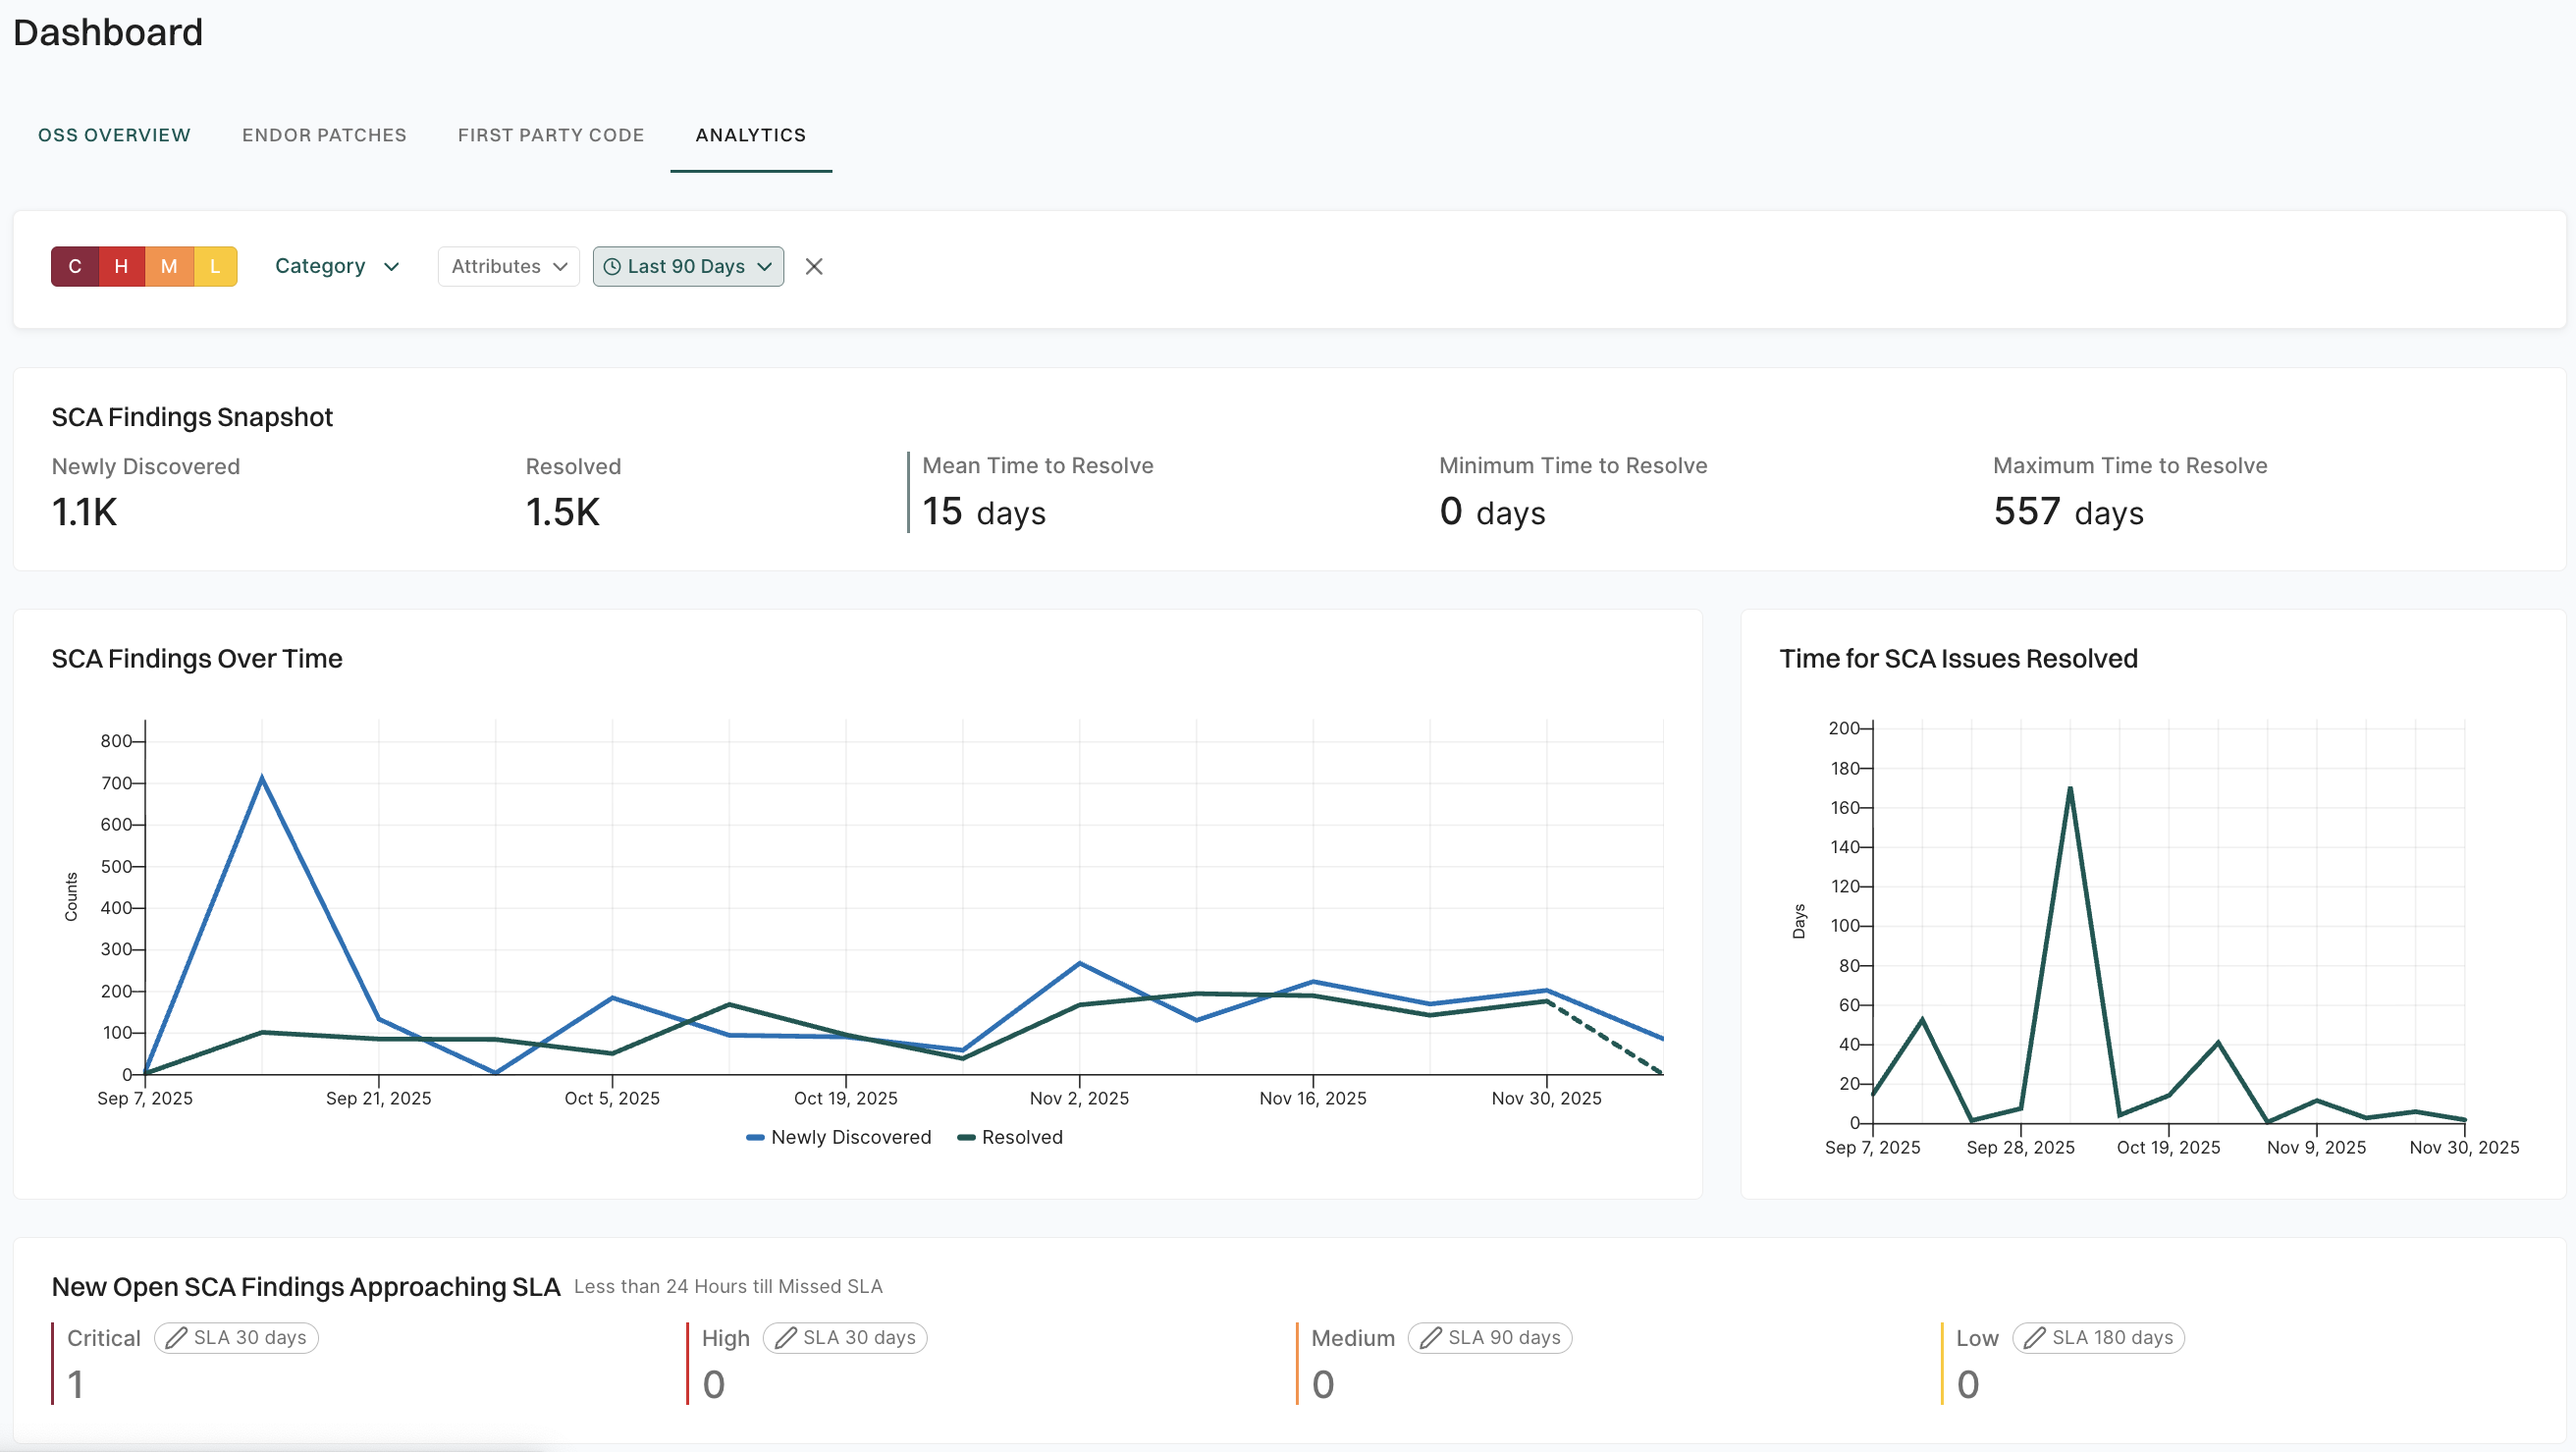
Findings snapshot metrics
Get a quick overview of key metrics for the selected category, helping you monitor newly identified and resolved findings, as well as the time it takes to address them. Here’s what each metric represents:
Newly Discovered: The number of findings recently identified across your projects. This count indicates areas that may need attention or remediation.
Resolved: The number of findings that have been fixed or mitigated recently, reflecting progress in securing your projects.
Mean Time to Resolve: The average time, in days, it takes to resolve a finding once discovered. Lowering this number can indicate faster responses to security issues.
Minimum Time to Resolve: The shortest time it took to resolve a finding in the current tracking period, providing insight into how quickly issues can be addressed.
Maximum Time to Resolve: The longest time it took to resolve a finding, showing the upper range for resolution times and highlighting areas where responses might need improvement.
These metrics help track security effectiveness over time and identify trends in finding resolution within your projects.
Analytics for AI models, SCA, SAST, secrets, and container
When you select AI models, SCA, SAST, secrets, or container as the category filter, the dashboard displays the following sections.
Findings over time
The Findings over Time chart tracks the number of newly discovered and resolved findings across your projects over the selected period. This view helps you analyze trends in finding discovery and resolution, showing whether security issues are increasing, decreasing, or remaining steady over time.
Time for issues resolved
The Time for Issues Resolved chart displays the number of days taken to resolve issues over the selected period. This metric helps assess response efficiency, highlighting how quickly security and other issues are addressed, and can indicate improvements or delays in issue resolution processes.
New open findings approaching SLA
The New Open Findings Approaching SLA section shows findings that are close to missing their resolution deadlines, with less than 24 hours remaining. This allows you to prioritize issues and take immediate action to resolve them before the SLA is missed. To define or adjust SLA durations, see Set SLA for findings.
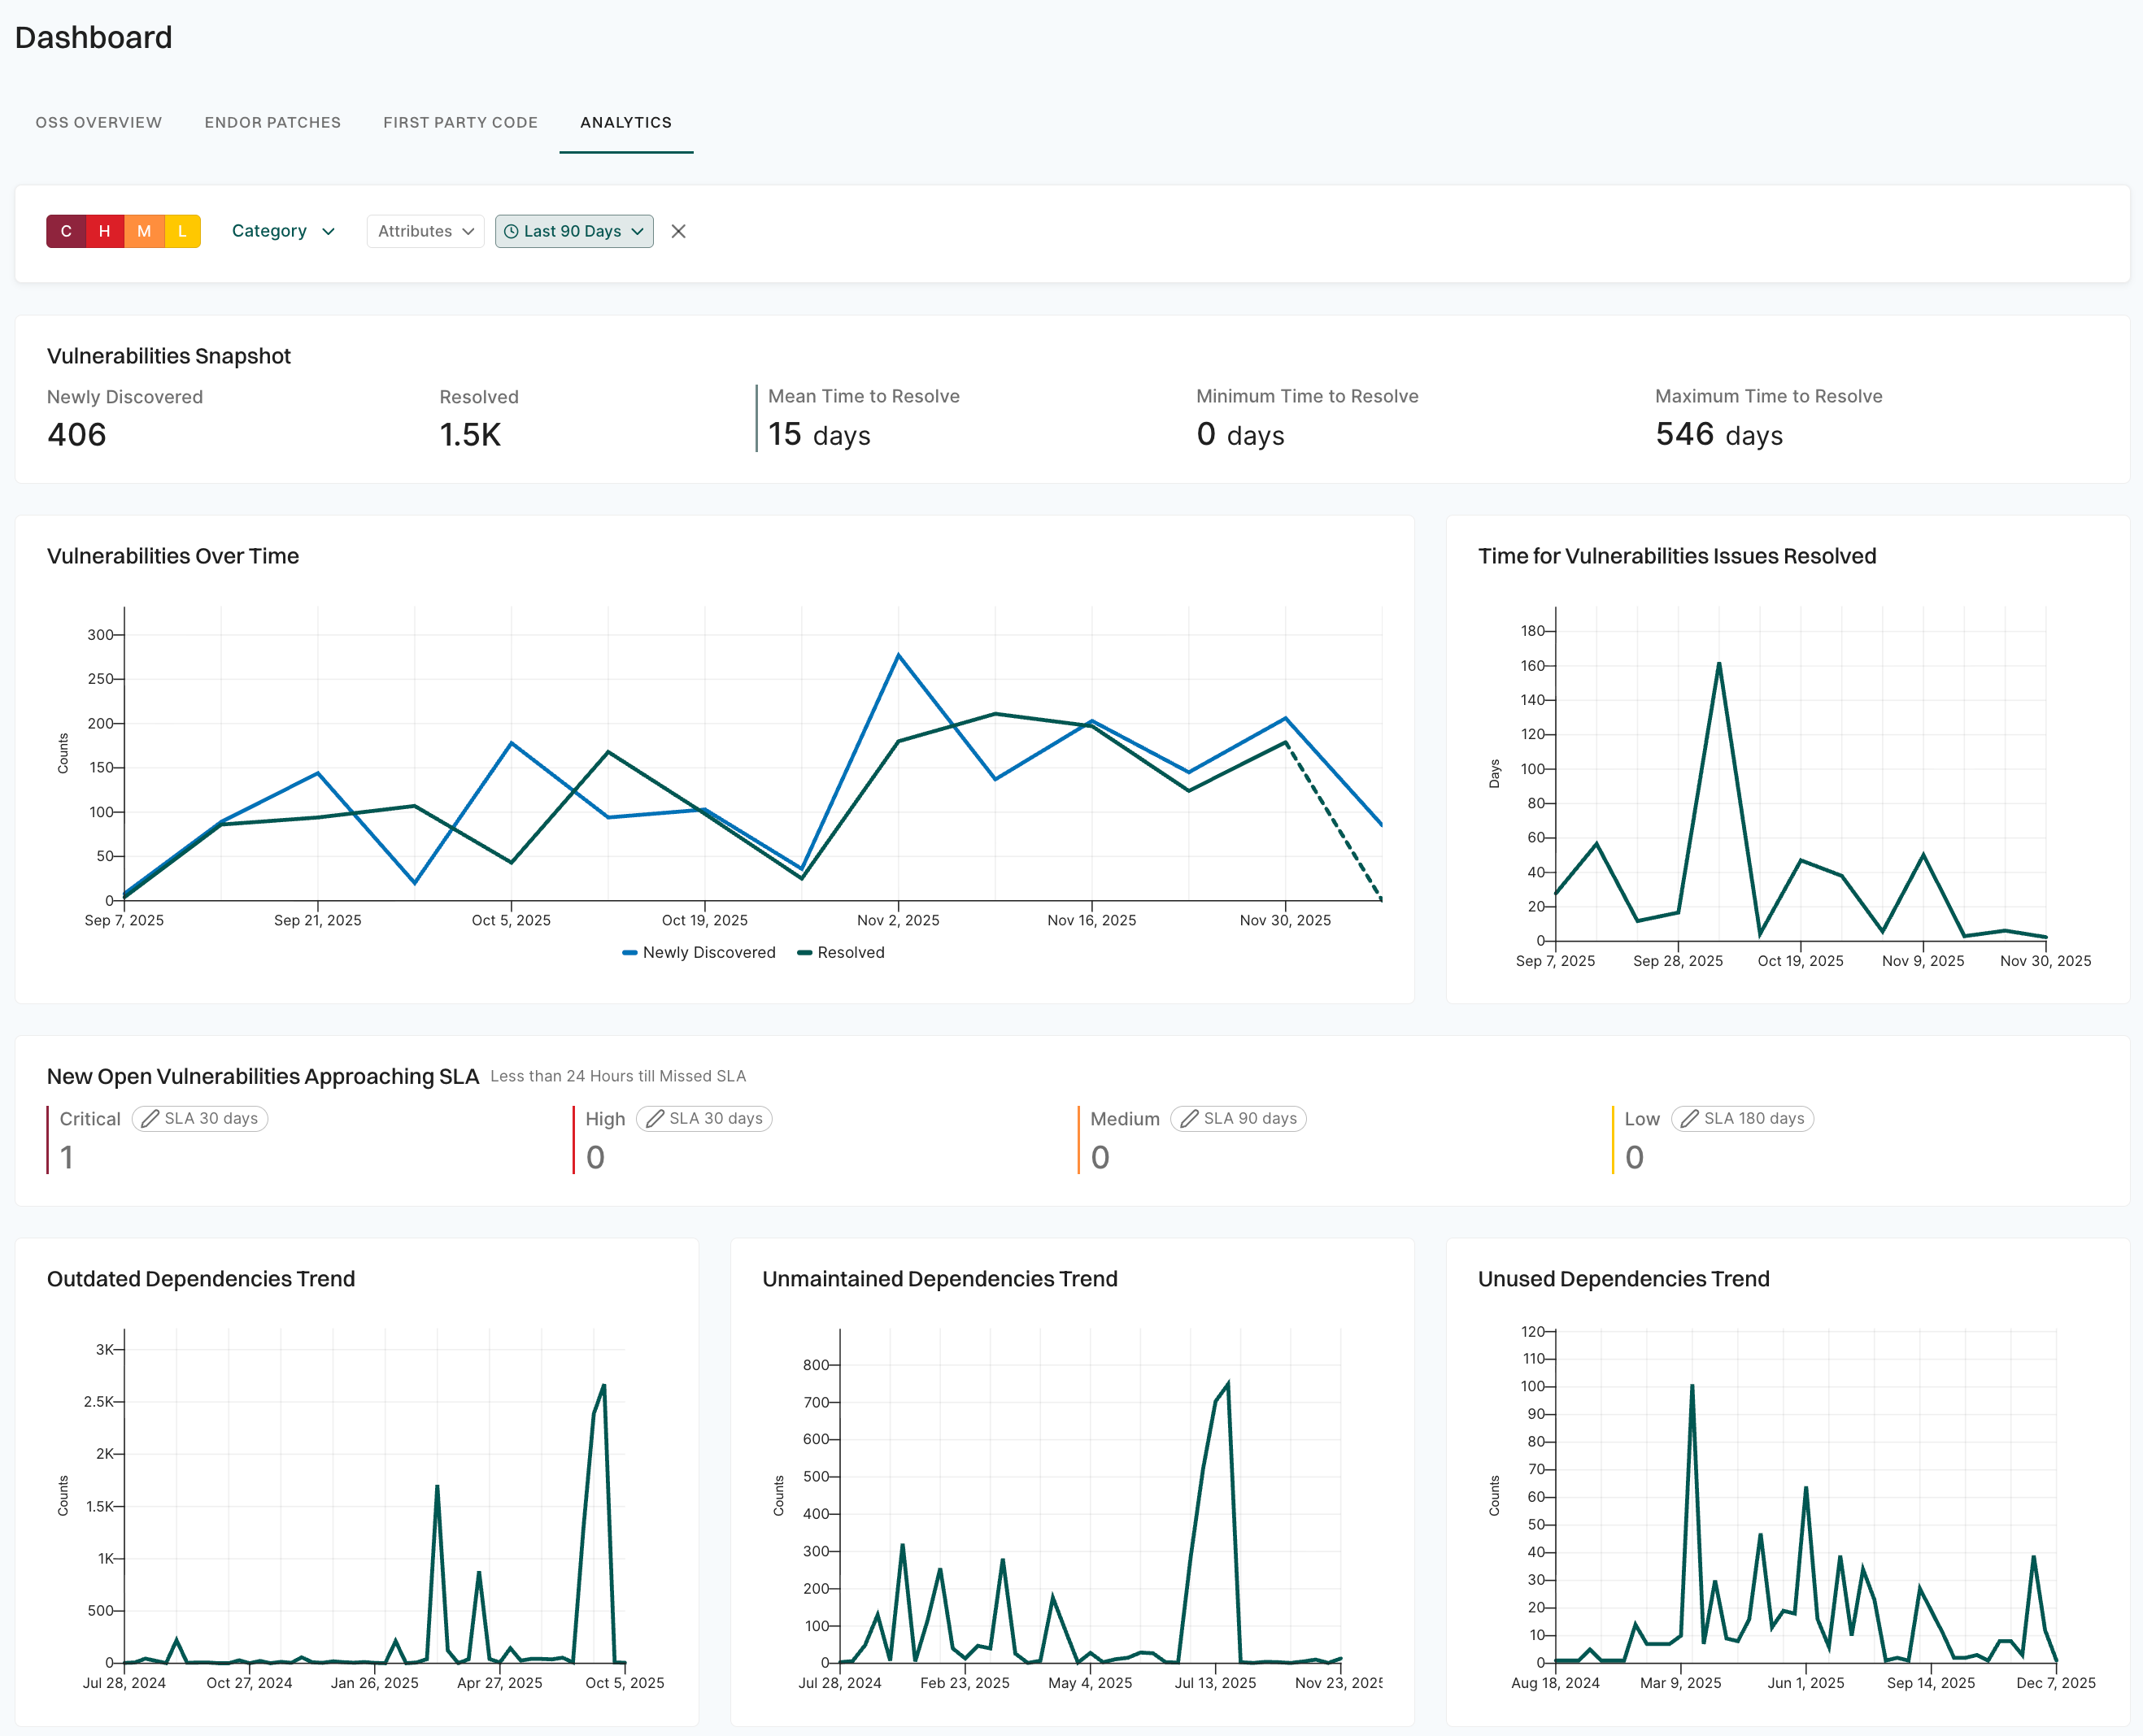
Analytics for vulnerabilities
When you select Vulnerability as the category filter, the dashboard displays all the charts and metrics described above, plus additional dependency trend charts specific to vulnerability analysis.
Vulnerabilities over time
The Vulnerabilities over Time chart tracks the number of detected vulnerabilities across your projects over the selected period. This view helps you analyze trends in vulnerability discovery and resolution, showing whether security issues are increasing, decreasing, or remaining steady over time.
Time for vulnerabilities issues resolved
This chart displays the number of days taken to resolve vulnerability issues over the selected period. This metric helps assess response efficiency, highlighting how quickly vulnerabilities are addressed, and can indicate improvements or delays in issue resolution processes.
New open vulnerabilities approaching SLA
The New Open Vulnerabilities Approaching SLA section shows vulnerabilities that are close to missing their resolution deadlines, with less than 24 hours remaining. This allows you to prioritize issues and take immediate action to resolve them before the SLA is missed. To define or adjust SLA for different vulnerability severities, see Set SLA for findings.
Outdated dependencies trend
This chart tracks the number of outdated dependencies in your projects over time. It helps you monitor the progress of updating libraries and frameworks, providing insights into how many dependencies are no longer up-to-date. By identifying trends, you can prioritize updating critical dependencies, reduce security risks, and ensure your projects remain current with the latest versions.
Unmaintained dependencies trend
This chart shows the number of dependencies in your projects that are no longer actively maintained over time. This helps you track the accumulation of unsupported libraries and frameworks, which may pose security and compatibility risks. By monitoring this trend, you can take proactive steps to replace or update unmaintained dependencies, ensuring the stability and security of your projects.
Unused dependencies trend
This chart tracks the number of dependencies in your projects that are no longer in use over time. This helps identify redundant libraries or packages that can be safely removed, reducing the overall project size and improving performance. By monitoring this trend, you can streamline your codebase and reduce potential security risks from unnecessary dependencies.
Set SLA for findings
A Service Level Agreement (SLA) defines the expected time frame within which security findings should be addressed, based on their severity. It sets a deadline for resolving new open findings before they are considered approaching or breaching SLA.
Follow these steps to define SLA for findings:
Sign in to Endor Labs and navigate to Dashboard on the left sidebar.
Select ANALYTICS.
Scroll down to New Open Findings Approaching SLA and select a severity level to set the SLA for it. The default SLA for severities are:
Critical - 30 Days
High - 30 Days
Medium - 90 Days
Low - 180 Days
For example, click SLA duration for Critical to modify it.
In SLA DURATION, set a duration in days for the selected severity level.
Click Reset to restore the SLA to its default duration.
Click Save.
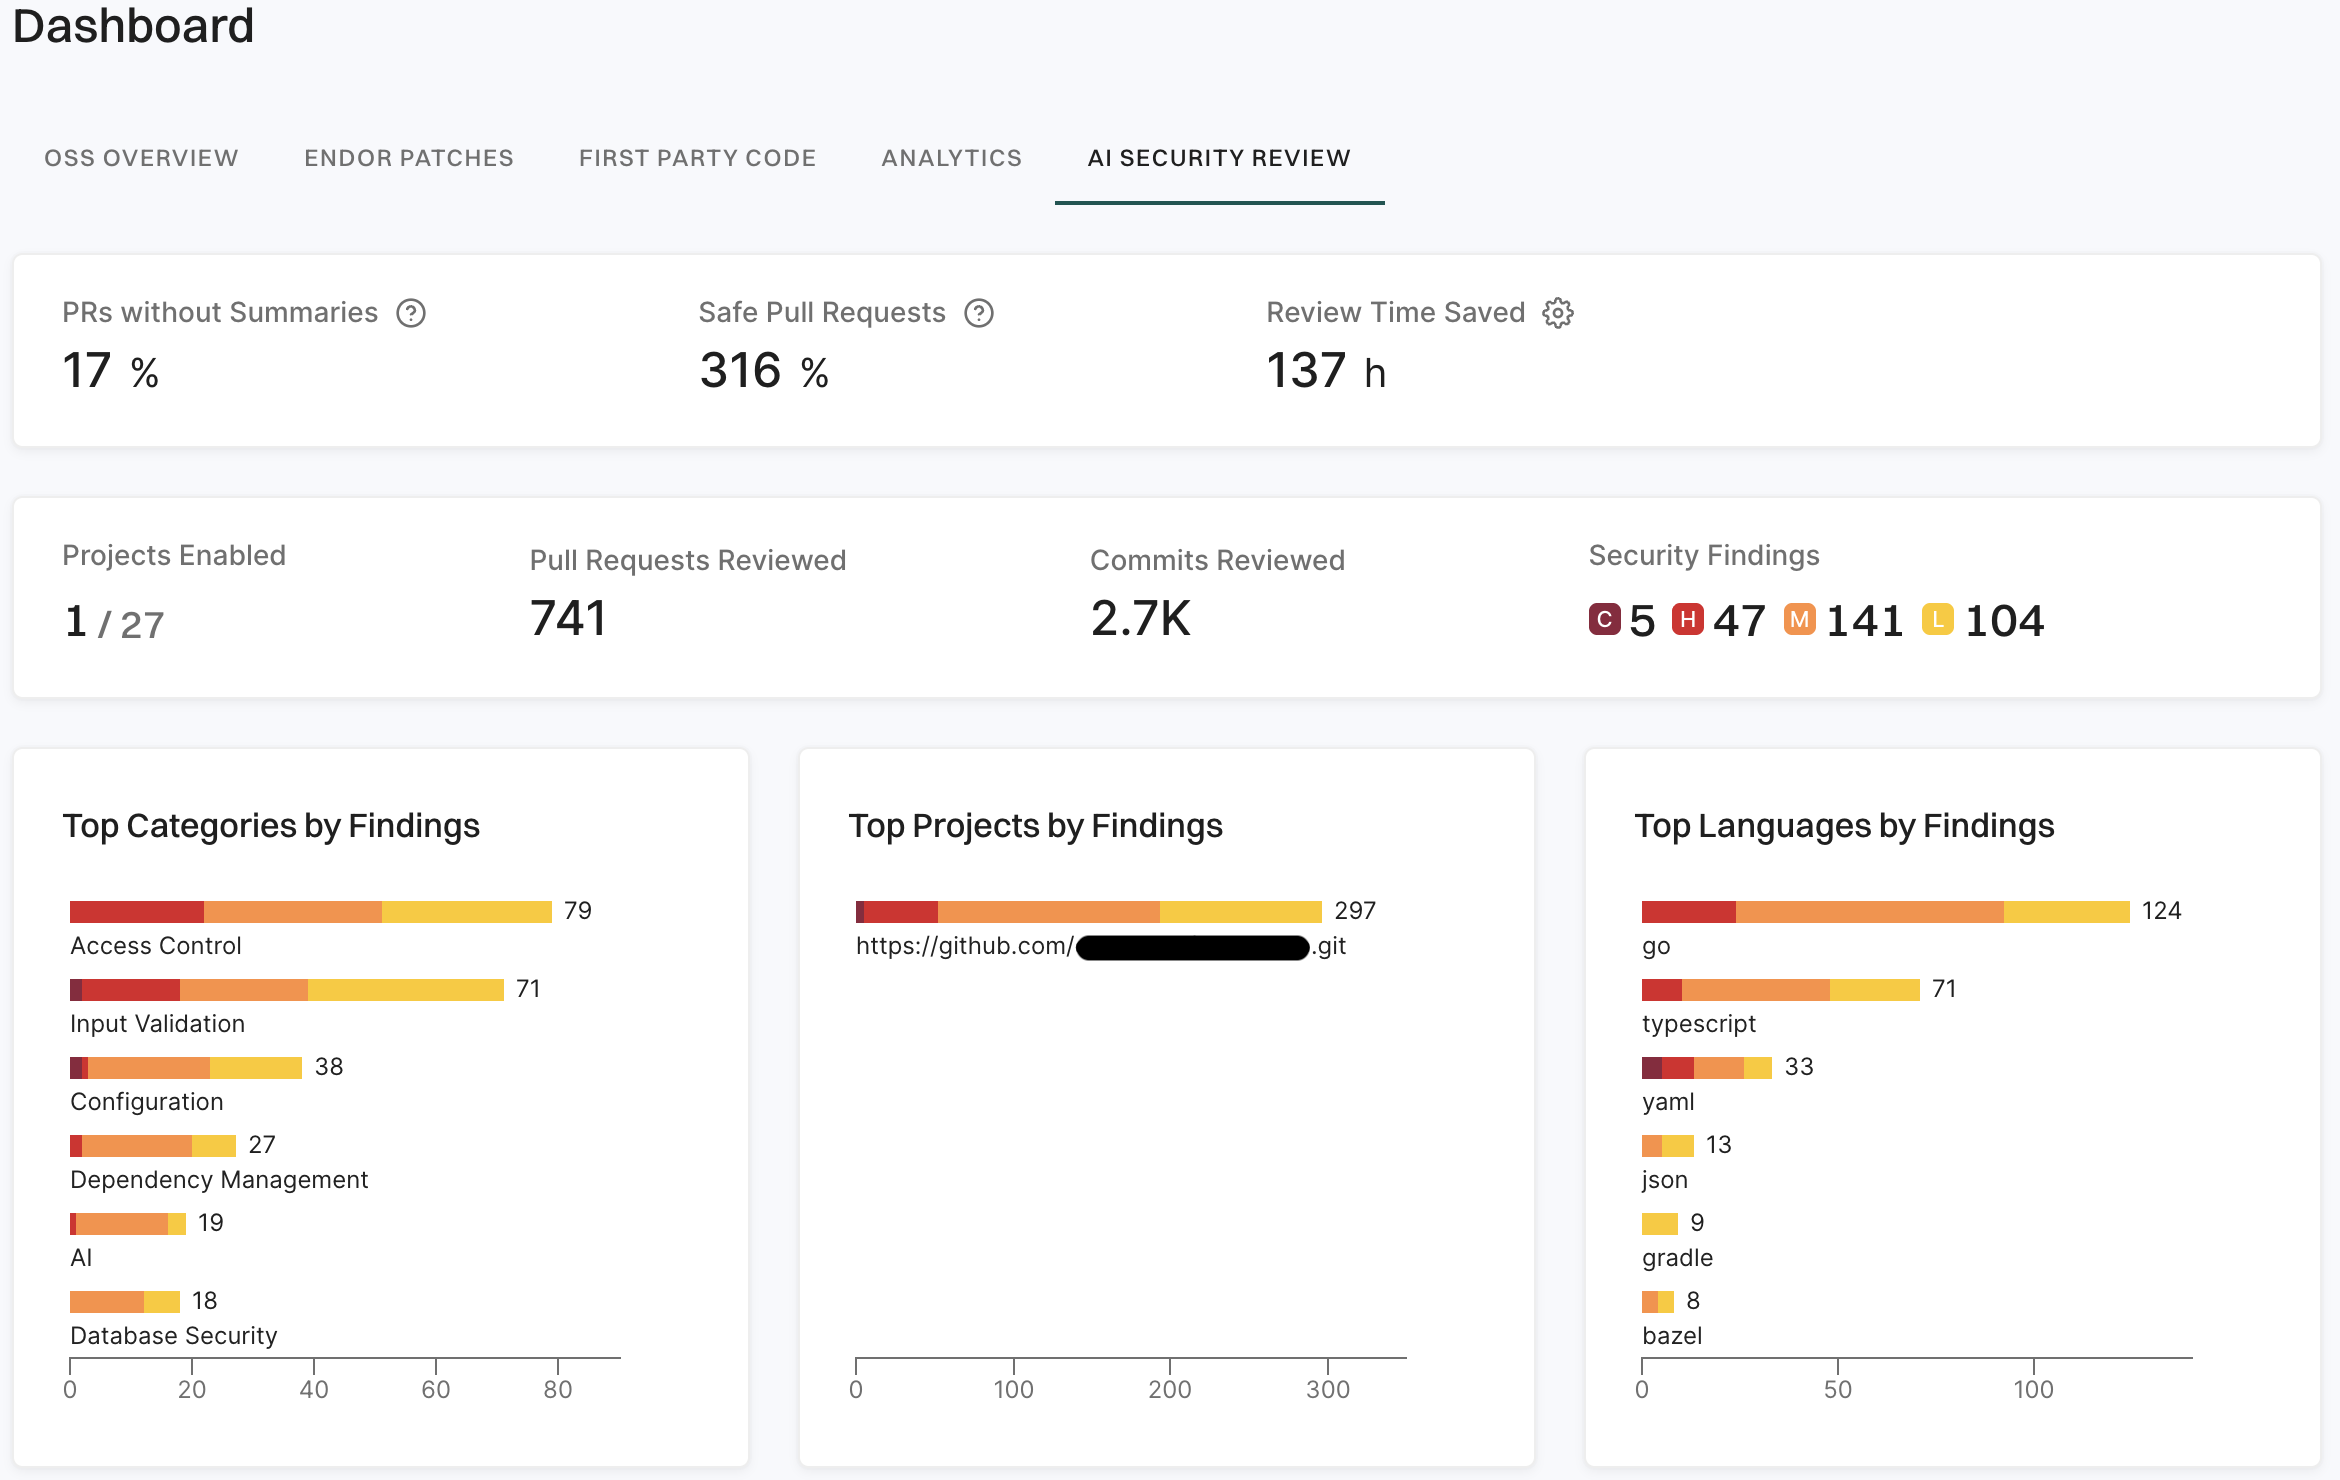
AI security code review
The AI security code review dashboard helps you understand the impact of AI security code review in your namespace.
You can view the following information in the AI security code review dashboard:
PRs without summaries: The percentage of pull requests that did not have a summary for which AI security code review generated meaningful summaries.
Safe Pull Requests: The percentage of pull requests that did not have any High or Critical vulnerabilities.
Review time saved: The estimated number of hours of developer time saved by AI security code review.
Projects enabled: The number of projects in the namespace that have AI security code review enabled.
Pull requests reviewed: The number of pull requests reviewed by AI security code review.
Commits reviewed: The number of commits reviewed by AI security code review.
Security findings: The number of security findings triggered by AI security code review, classified by severity.
You can also view the following widgets:
Top categories by findings: The categories of security vulnerabilities found in the namespace, ranked by the number of findings.
Top projects by findings: The projects in the namespace with the highest number of security vulnerabilities, ranked by the number of findings.
Top languages by findings: The languages in the namespace with the highest number of security vulnerabilities, ranked by the number of findings.
You can use these widgets to identify the most critical vulnerabilities and projects in your namespace.
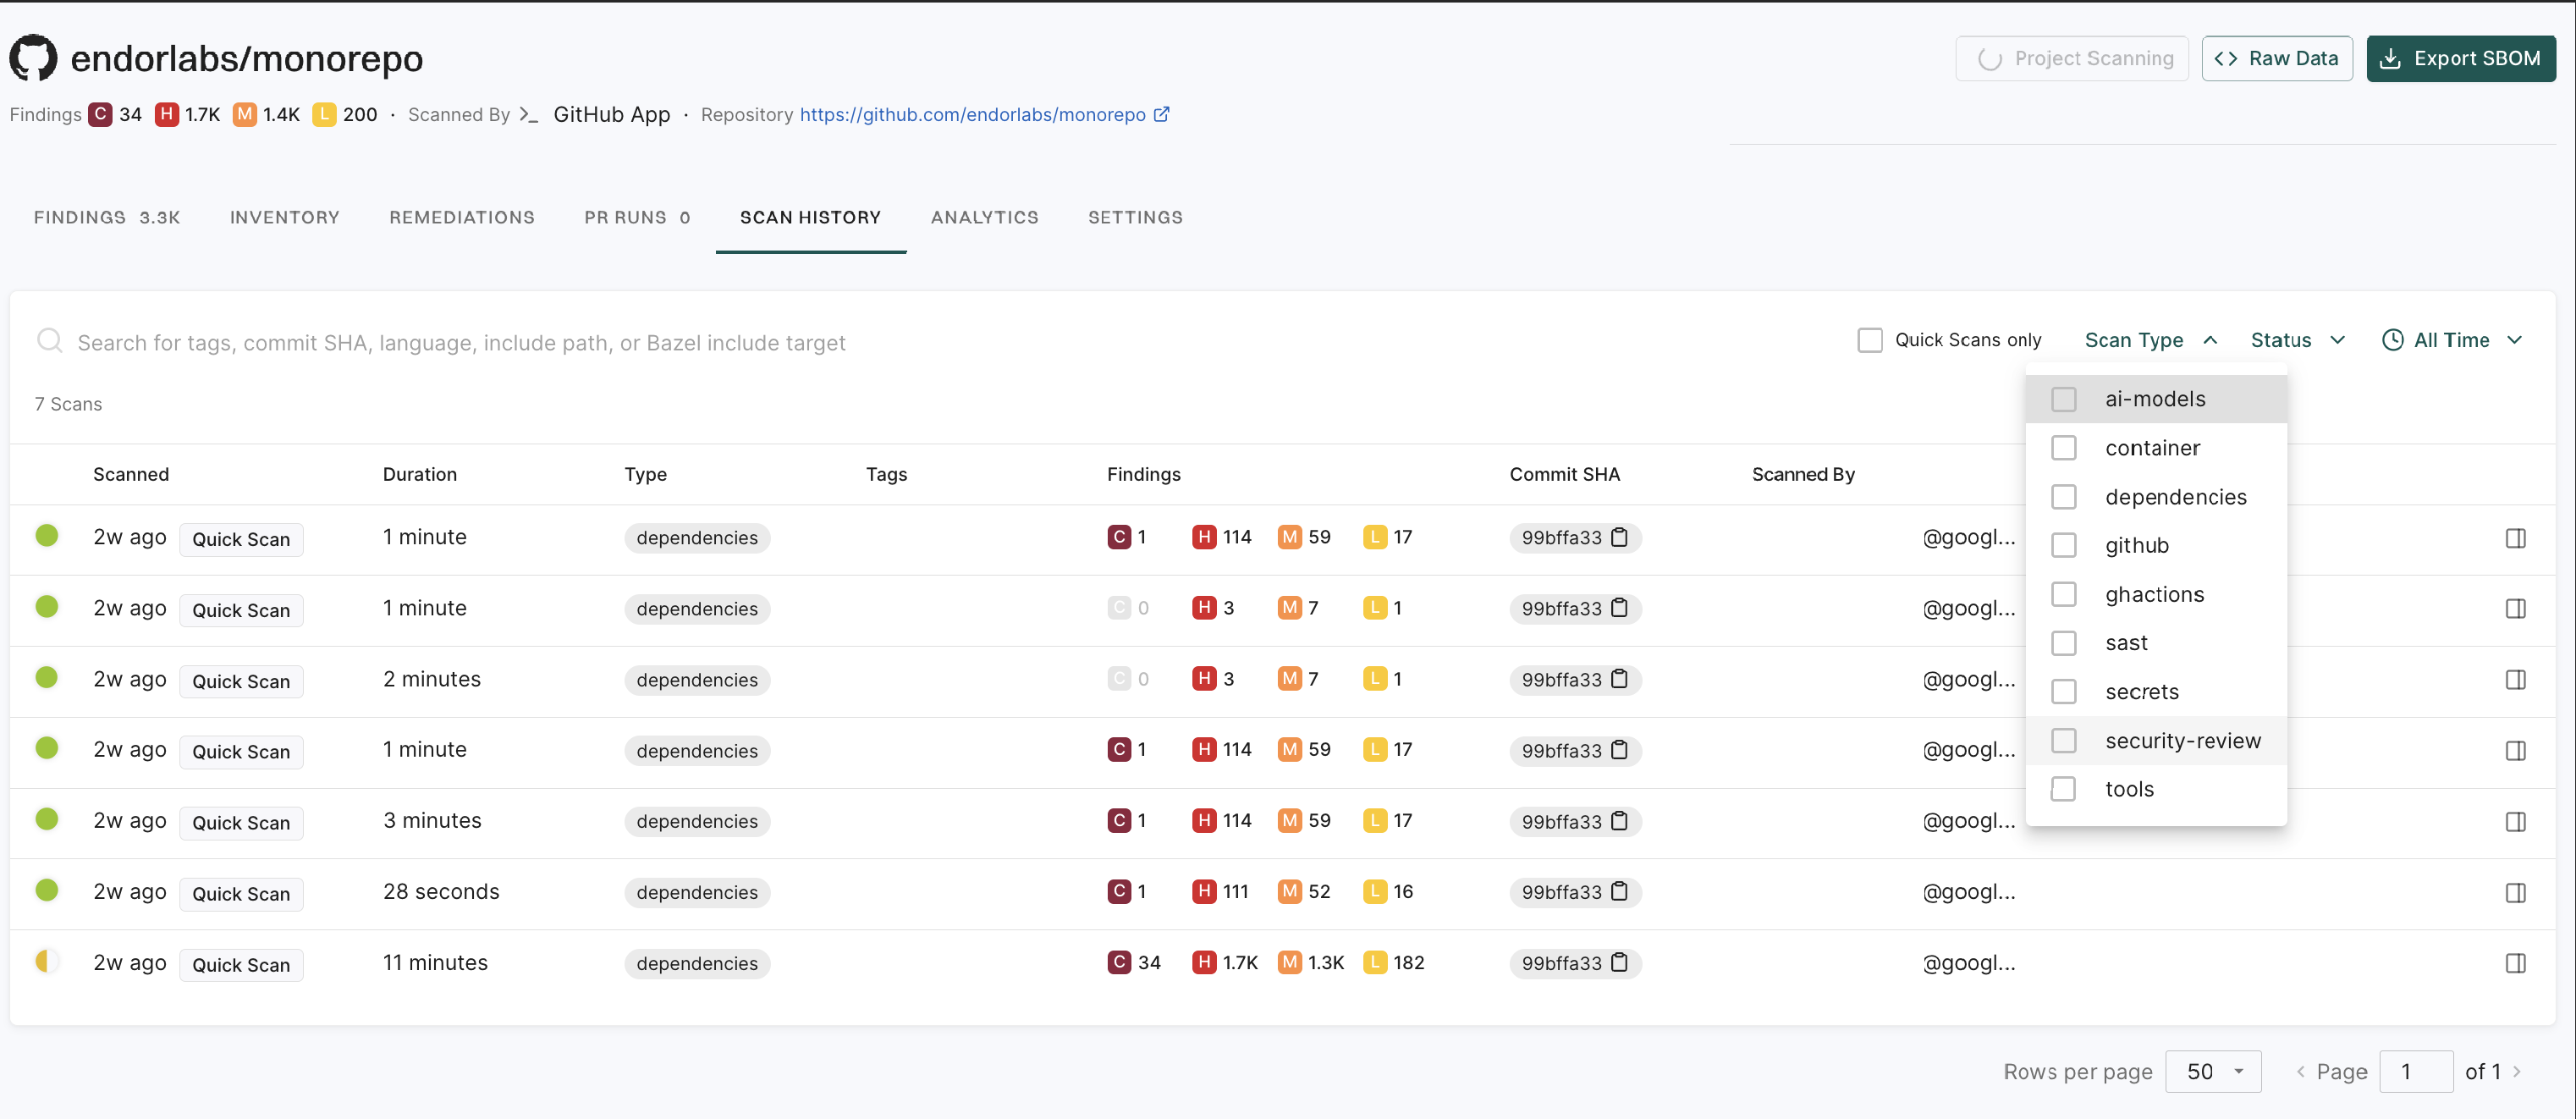
Scan history
Scan history provides a detailed overview of past security scans performed on a project. It helps you understand your project’s security posture over time. With full context and details about individual scans in their repositories, you can assess scan fidelity and troubleshoot issues.
Select Projects from the left sidebar.
Search for and select a project to review.
Select SCAN HISTORY to review the past scans.
List of Scans: View all past scans, including details such as the scan time, duration, scan type, and tags.
Findings Summary: Review the number of security findings, categorized by severity: Critical, High, Medium, or Low.
Commit Details: Each scan is linked to a specific commit SHA, allowing users to track security issues to specific code changes.
Scanned By: Identifies the user or system that initiated the scan.
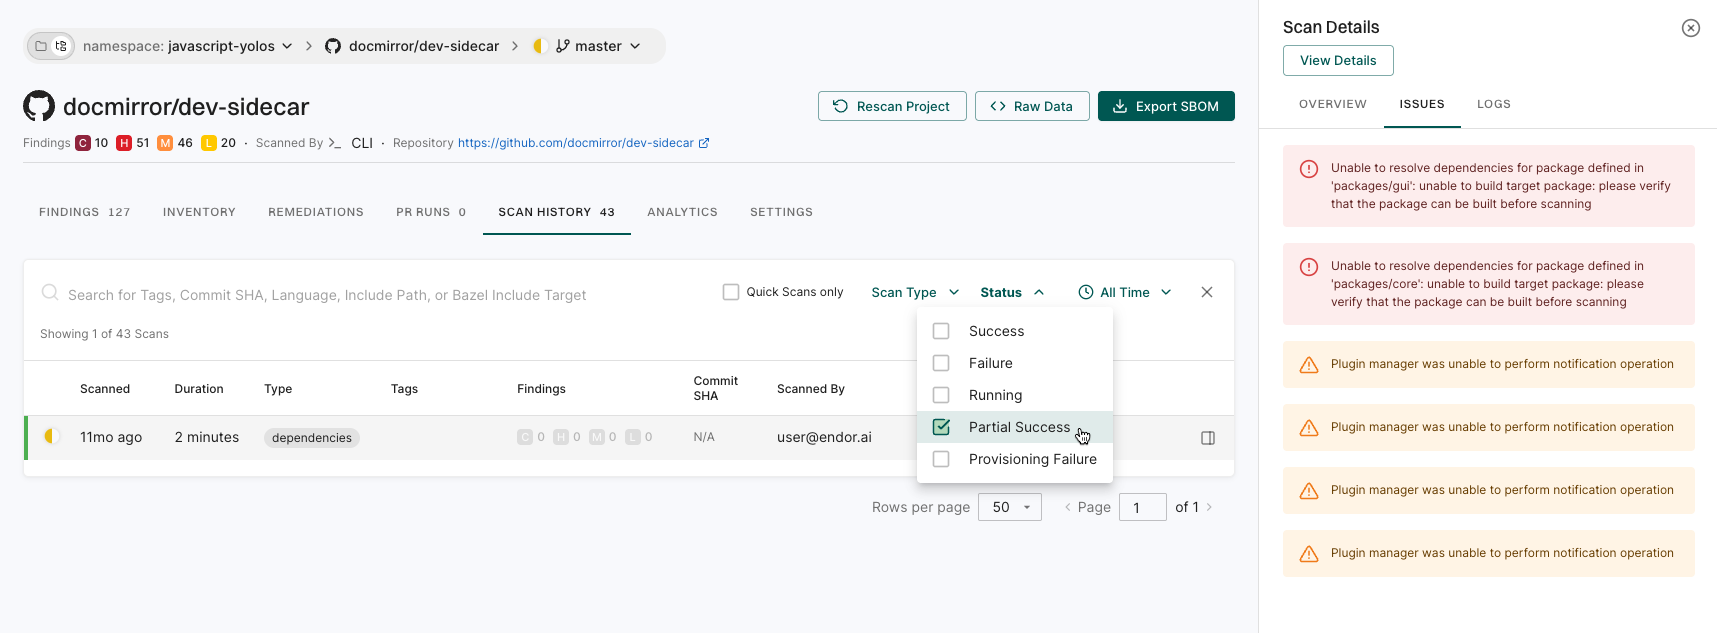
Filtering & Search: You can filter scans by status, scan type, and time range. You can search by tags, commit SHA, or specific include or exclude file paths.
For example, you can select Container as a scan type from the dropdown list.
Note
The analytics scan is a periodic, automated scan triggered by the system that refreshes findings without any user action. The scan is triggered only when the analytics-check scan detects changes or new vulnerabilities.
The analytics-check scan is an automated, recurring process that checks for changes or newly introduced vulnerabilities and skips the analytics scan if no changes are detected.
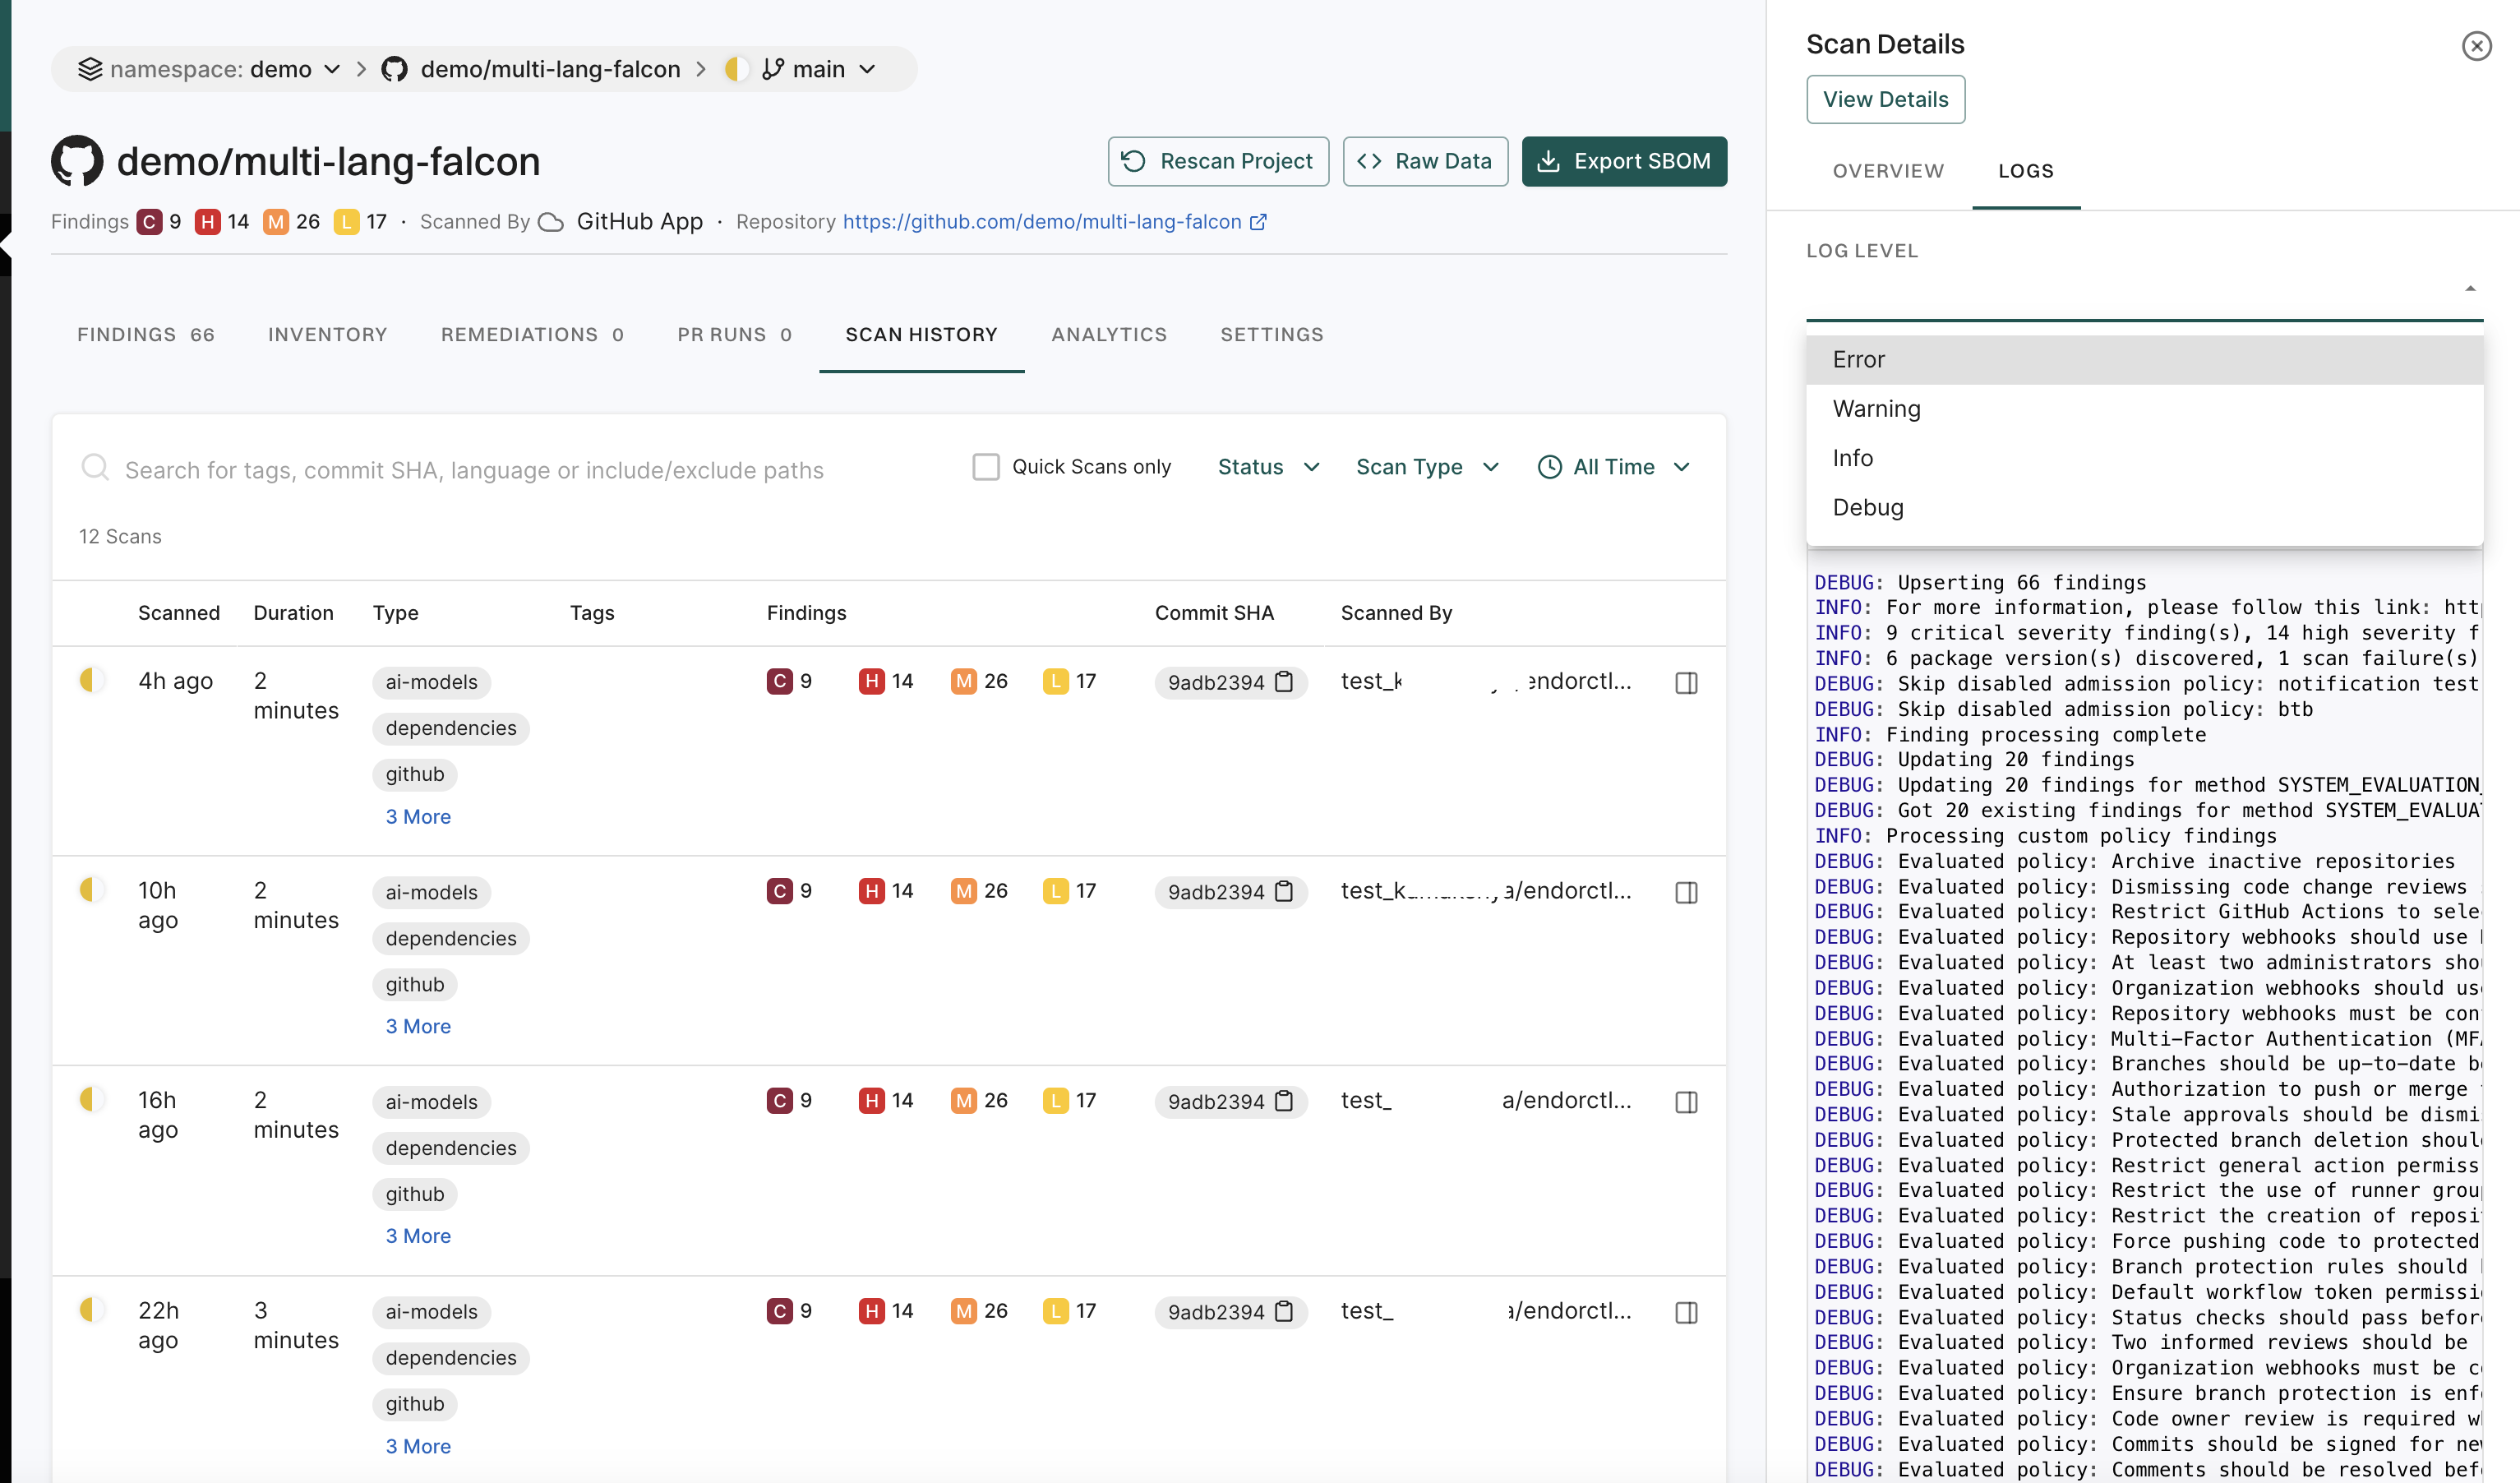
Select a record to view general information about the scan or its logs.
View details: View scan details for in-depth information about a specific scan, including the scan status, result UUID, detected programming languages, system details, and the versions of key development tools used in the environment.
Overview: General information about the scans.
Logs: Monitor scan logs, even while scans are running, and filter by severity level, with selectable log severity from Emergency, Alert, Critical, Error, Warning, Notice, Info, or Debug for in-depth debugging and policy evaluations.
You can access scan logs and toolchain details for projects onboarded through Endor Labs cloud using the GitHub, GitLab, or Azure DevOps Apps. The log levels in the selected scan result determine the available log severities.
Issues: View additional errors and warnings from the scan.
Dependencies
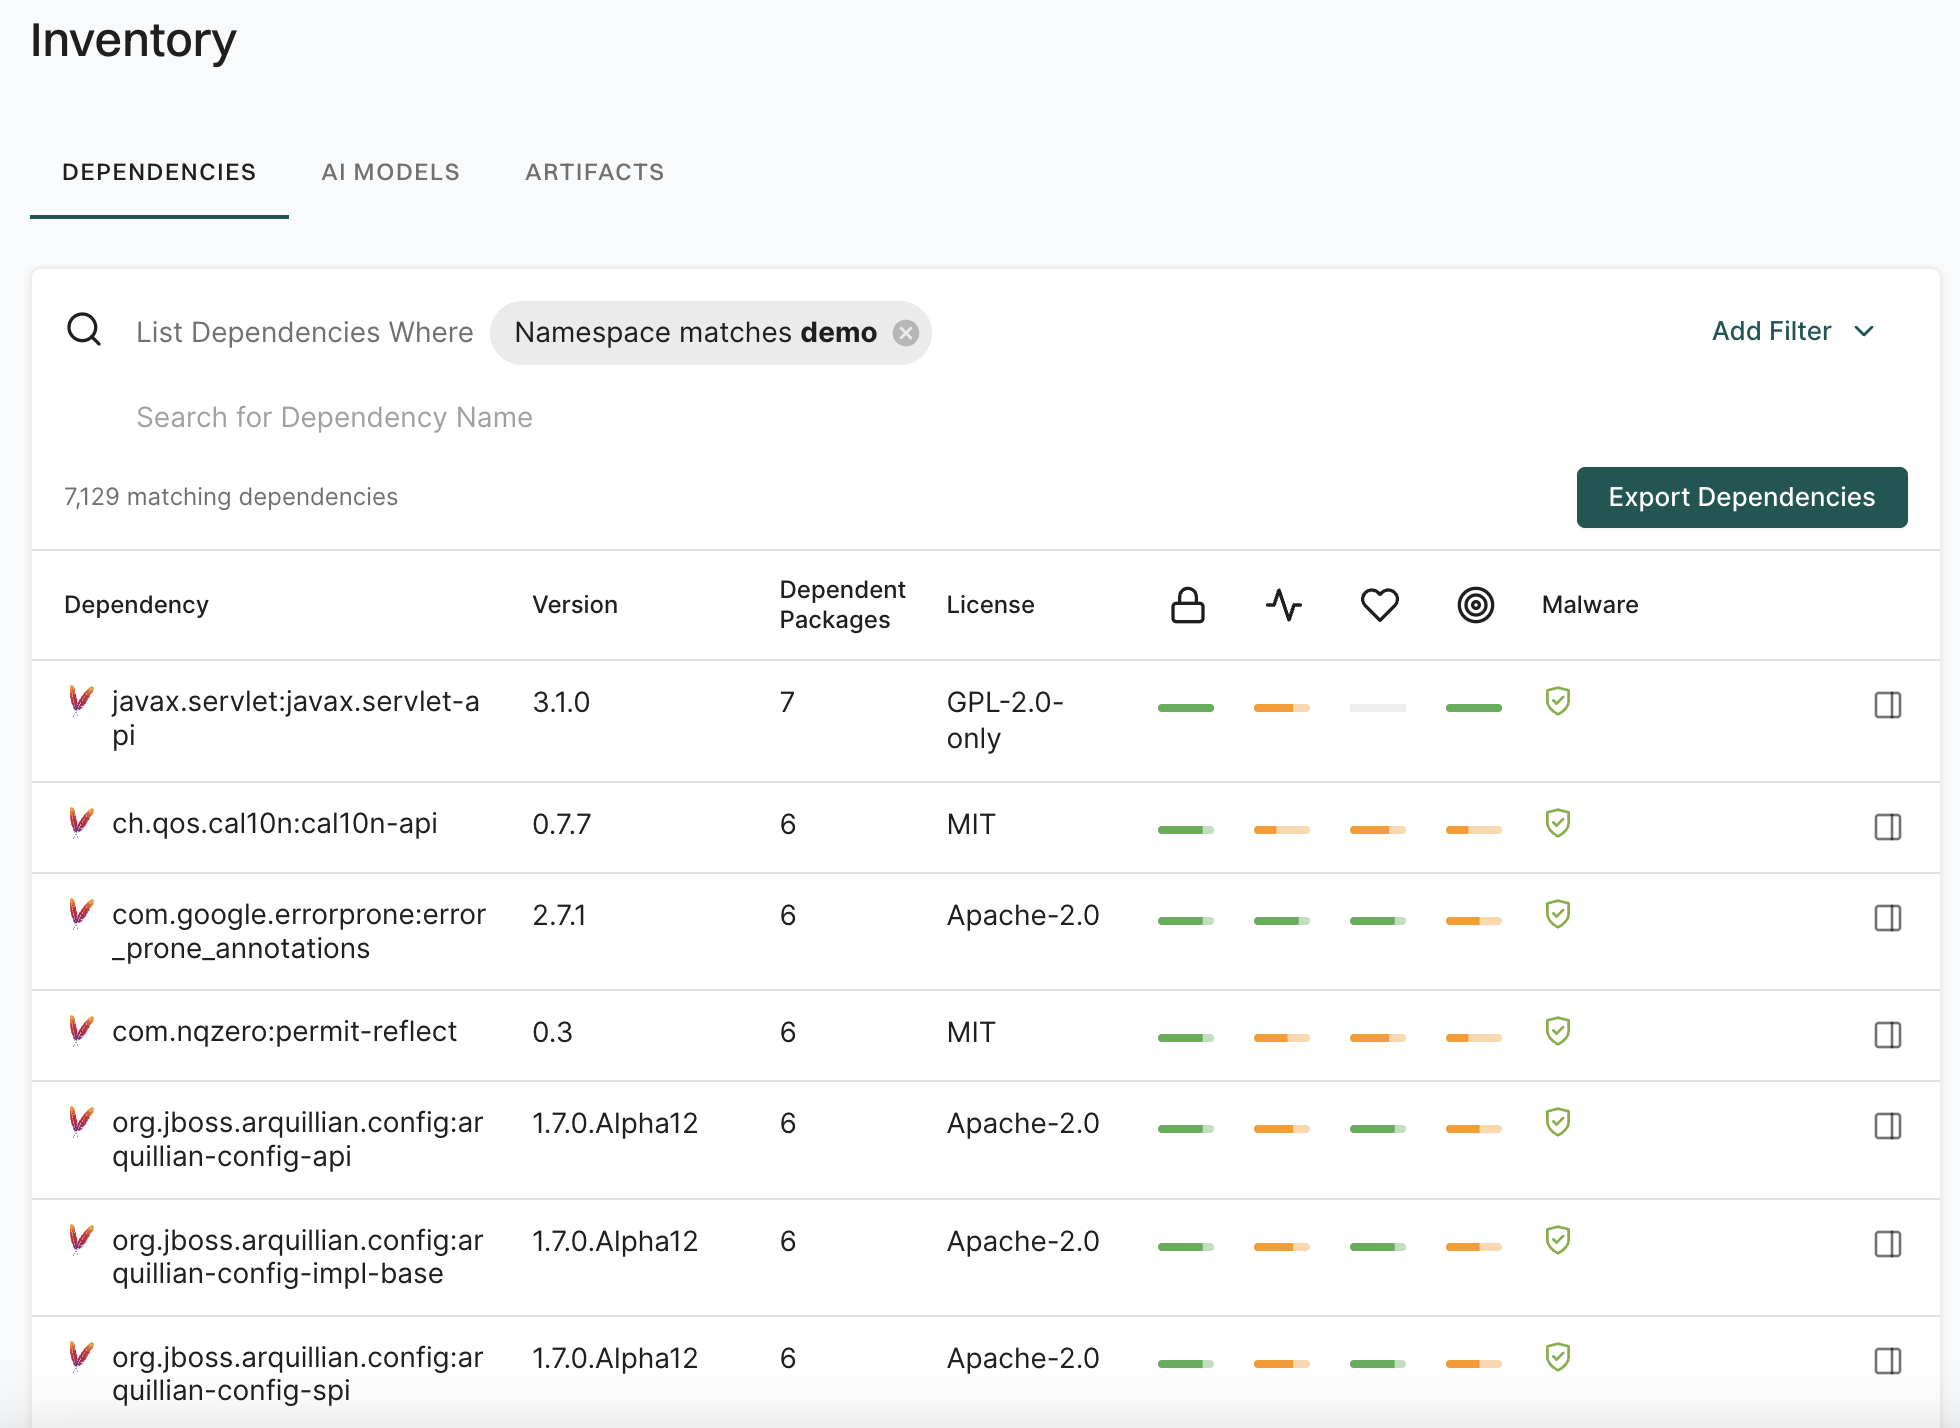
You can view project dependencies discovered in your tenant. Additionally, you can search for dependencies using specific criteria or apply predefined filters to find relevant results.
Select Inventory > Dependencies from the left sidebar to view the list of dependencies in your namespace, along with their Endor scores and malware status. The list also includes dependencies from all child namespaces.
Search dependencies
You can use the search bar to enter a search string to filter the search results based on the dependency name. You can enter multiple search strings.
Filter dependencies
You can also filter the dependencies by providing a filter criteria.
Click Add Filter and select List Dependencies Where.
Choose the filter criteria from the dropdown list and choose the filter operator.
Enter the filter values.
Click Apply Filter to apply the filter.
You can choose to add multiple filters.
The following example shows how to add a filter for reachable dependencies with the ecosystem as Maven.
Do not use! Draft content. Development in progress.
Filter dependencies to search, prioritize, and manage dependencies across your organization. You can filter dependencies by providing a filter criteria in the following way:
Select Inventory > Dependencies from the left sidebar.
Filter your dependencies using the list of available filters in the filter bar.
Toggle the Advanced option in the filter bar to apply API-style filters.
You can combine multiple filters to create more specific searches and narrow down the dependency list based on multiple criteria.
You can also use Search Suggestions to apply common queries with one click. These suggestions help you quickly segment the list for triage, upgrade planning, or ecosystem-specific reviews.
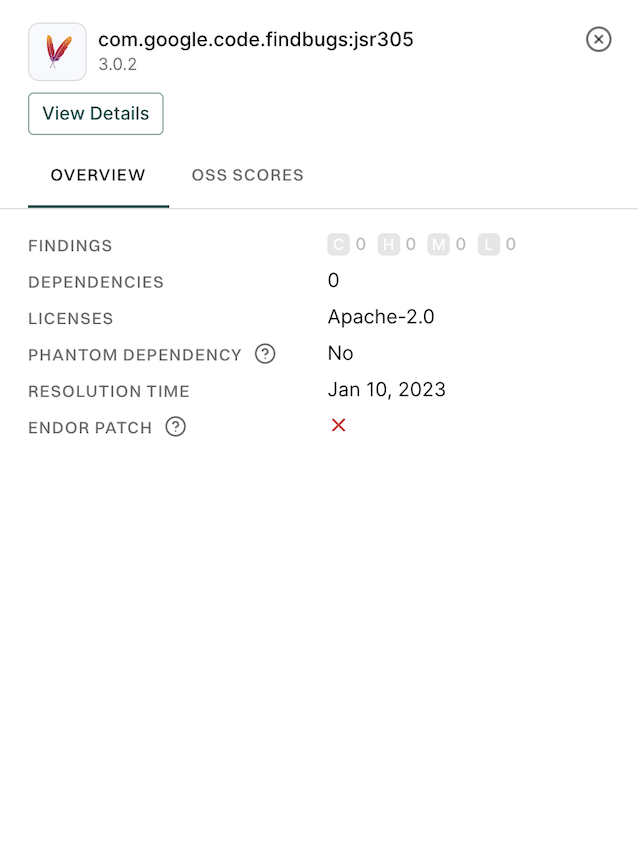
Select the dependency row to view the dependency details overview on the right sidebar.
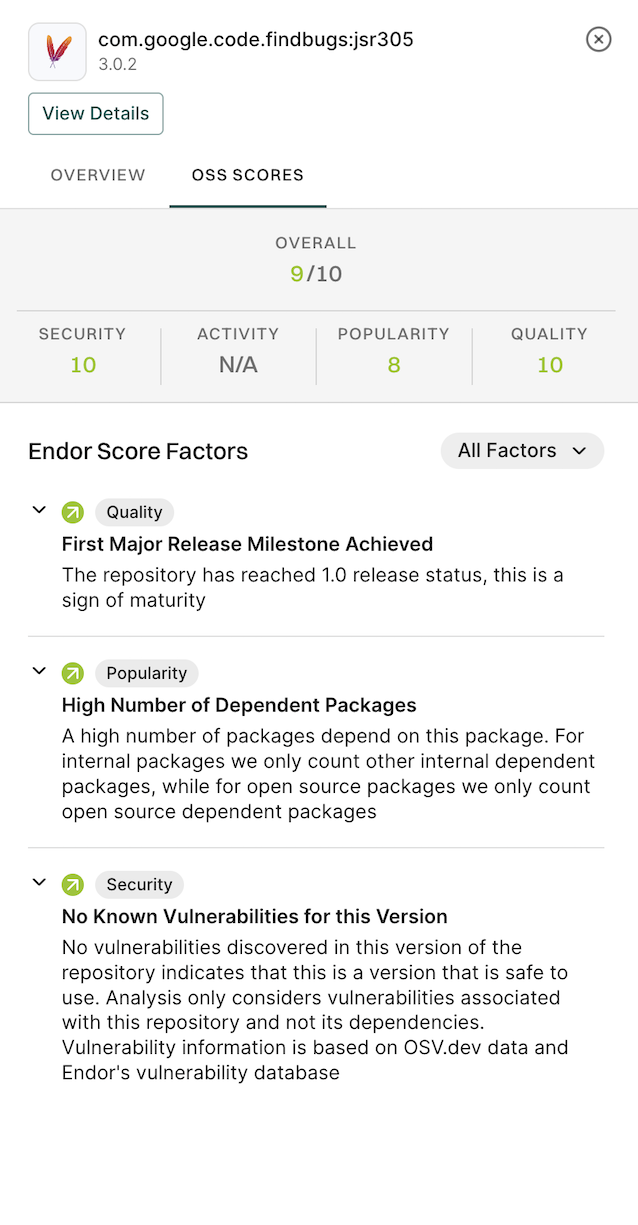
Select OSS Scores to view the score details for the dependency.
Click View Details to view the details of the dependency version.
View dependency details of the selected version
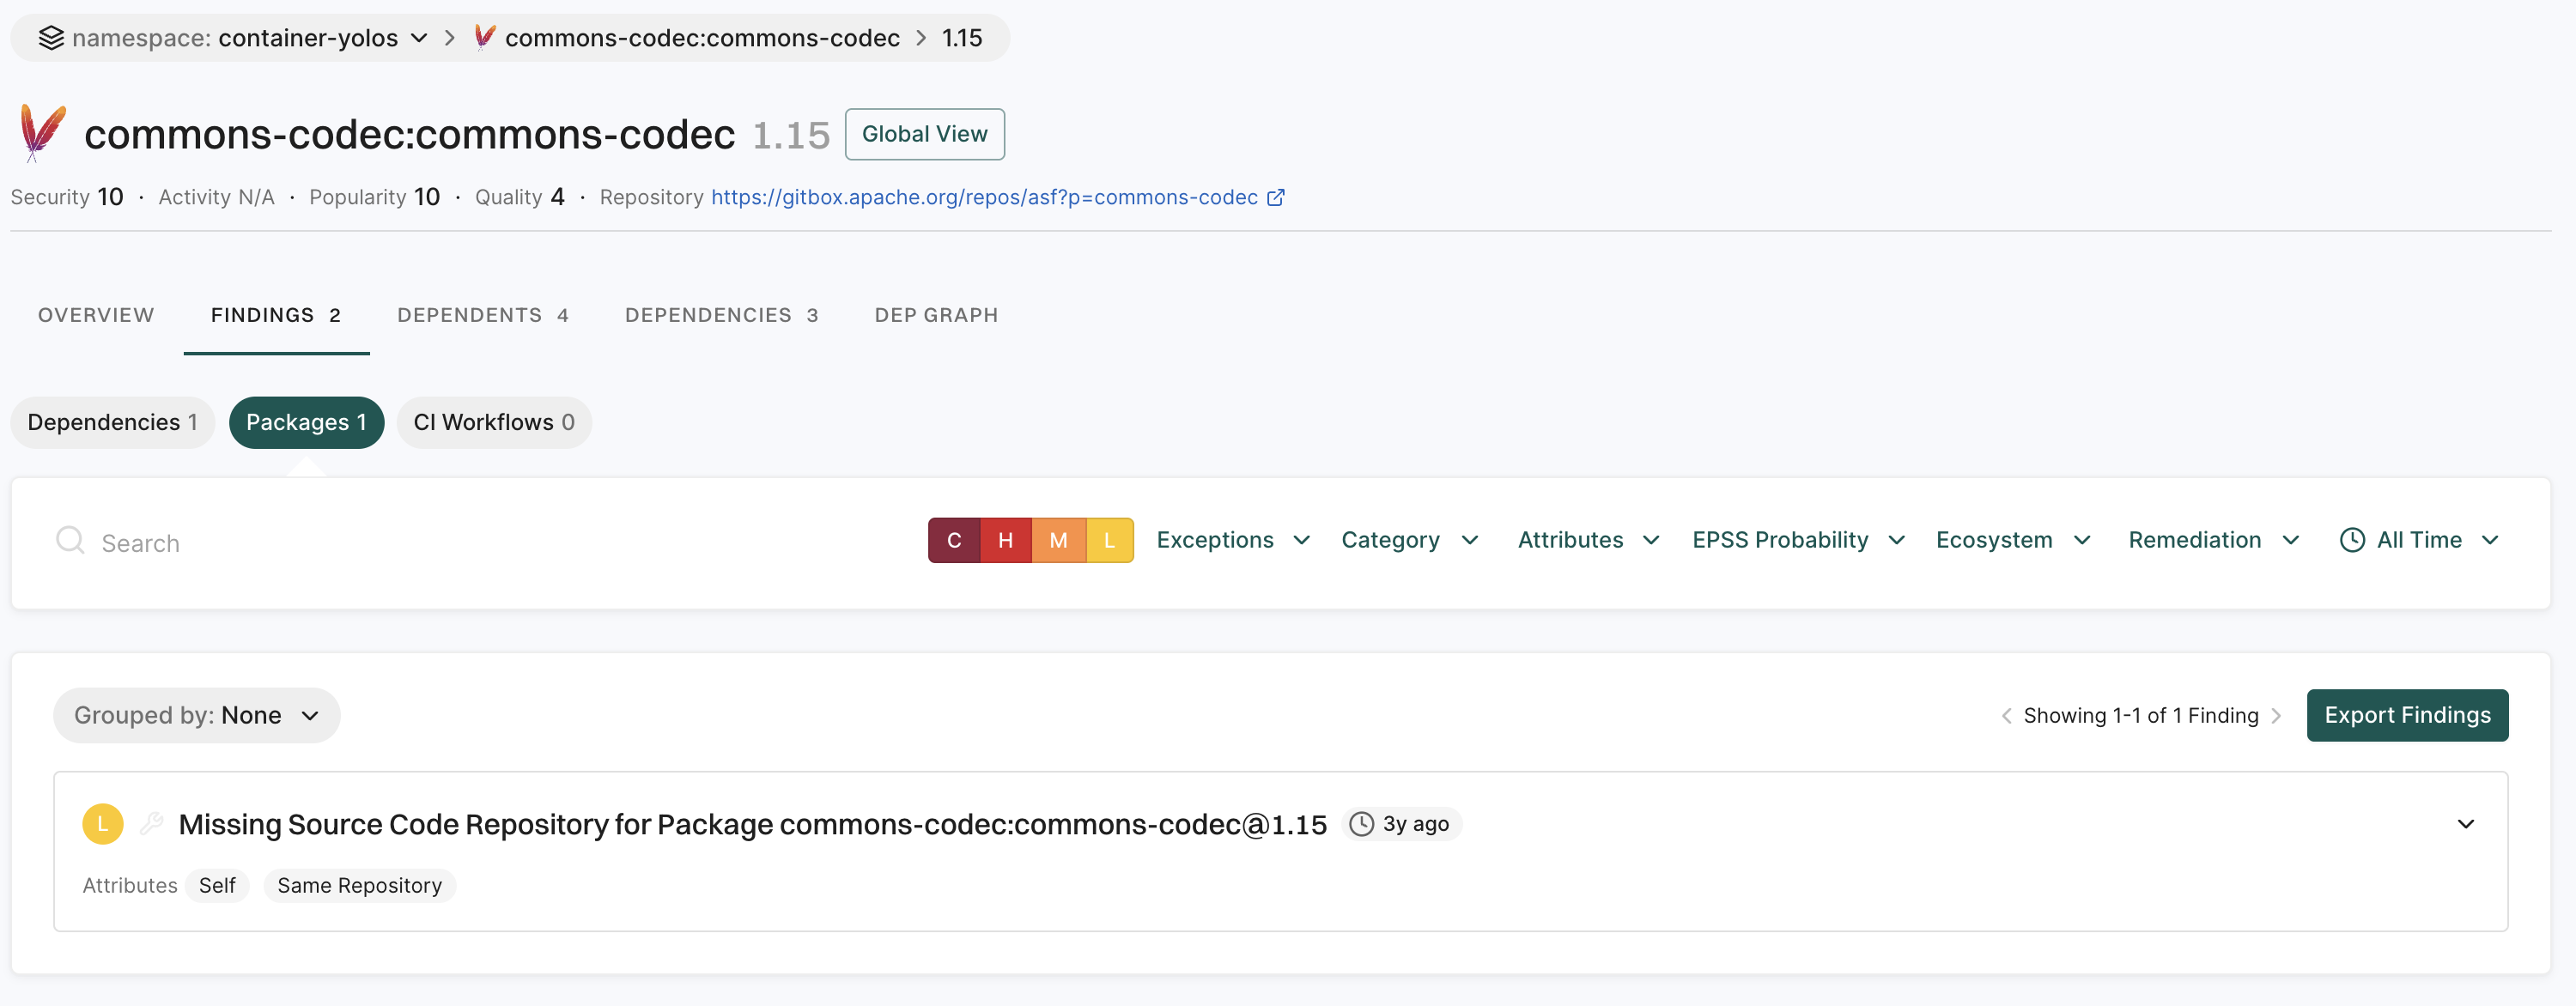
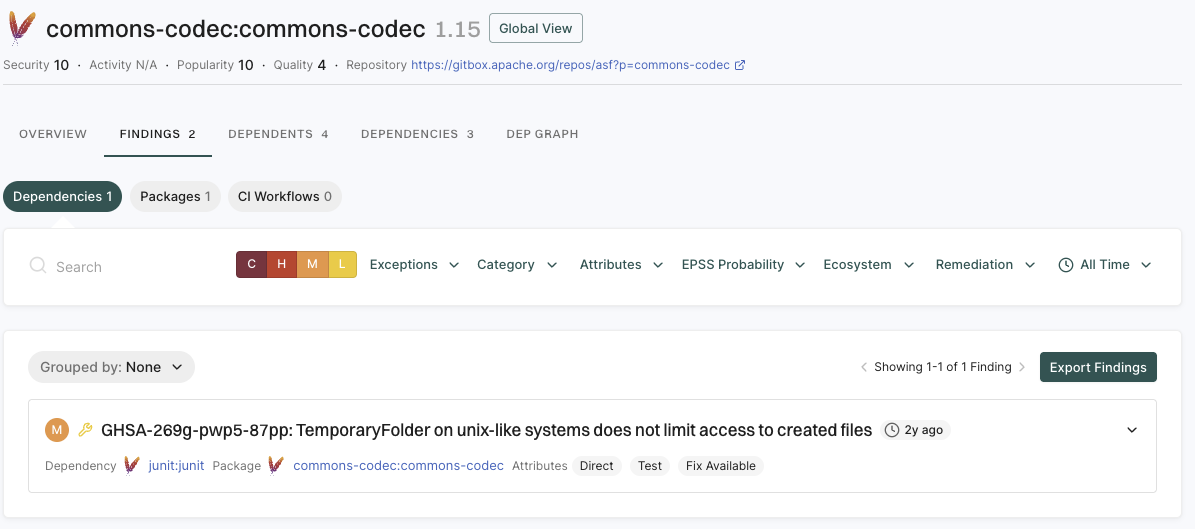
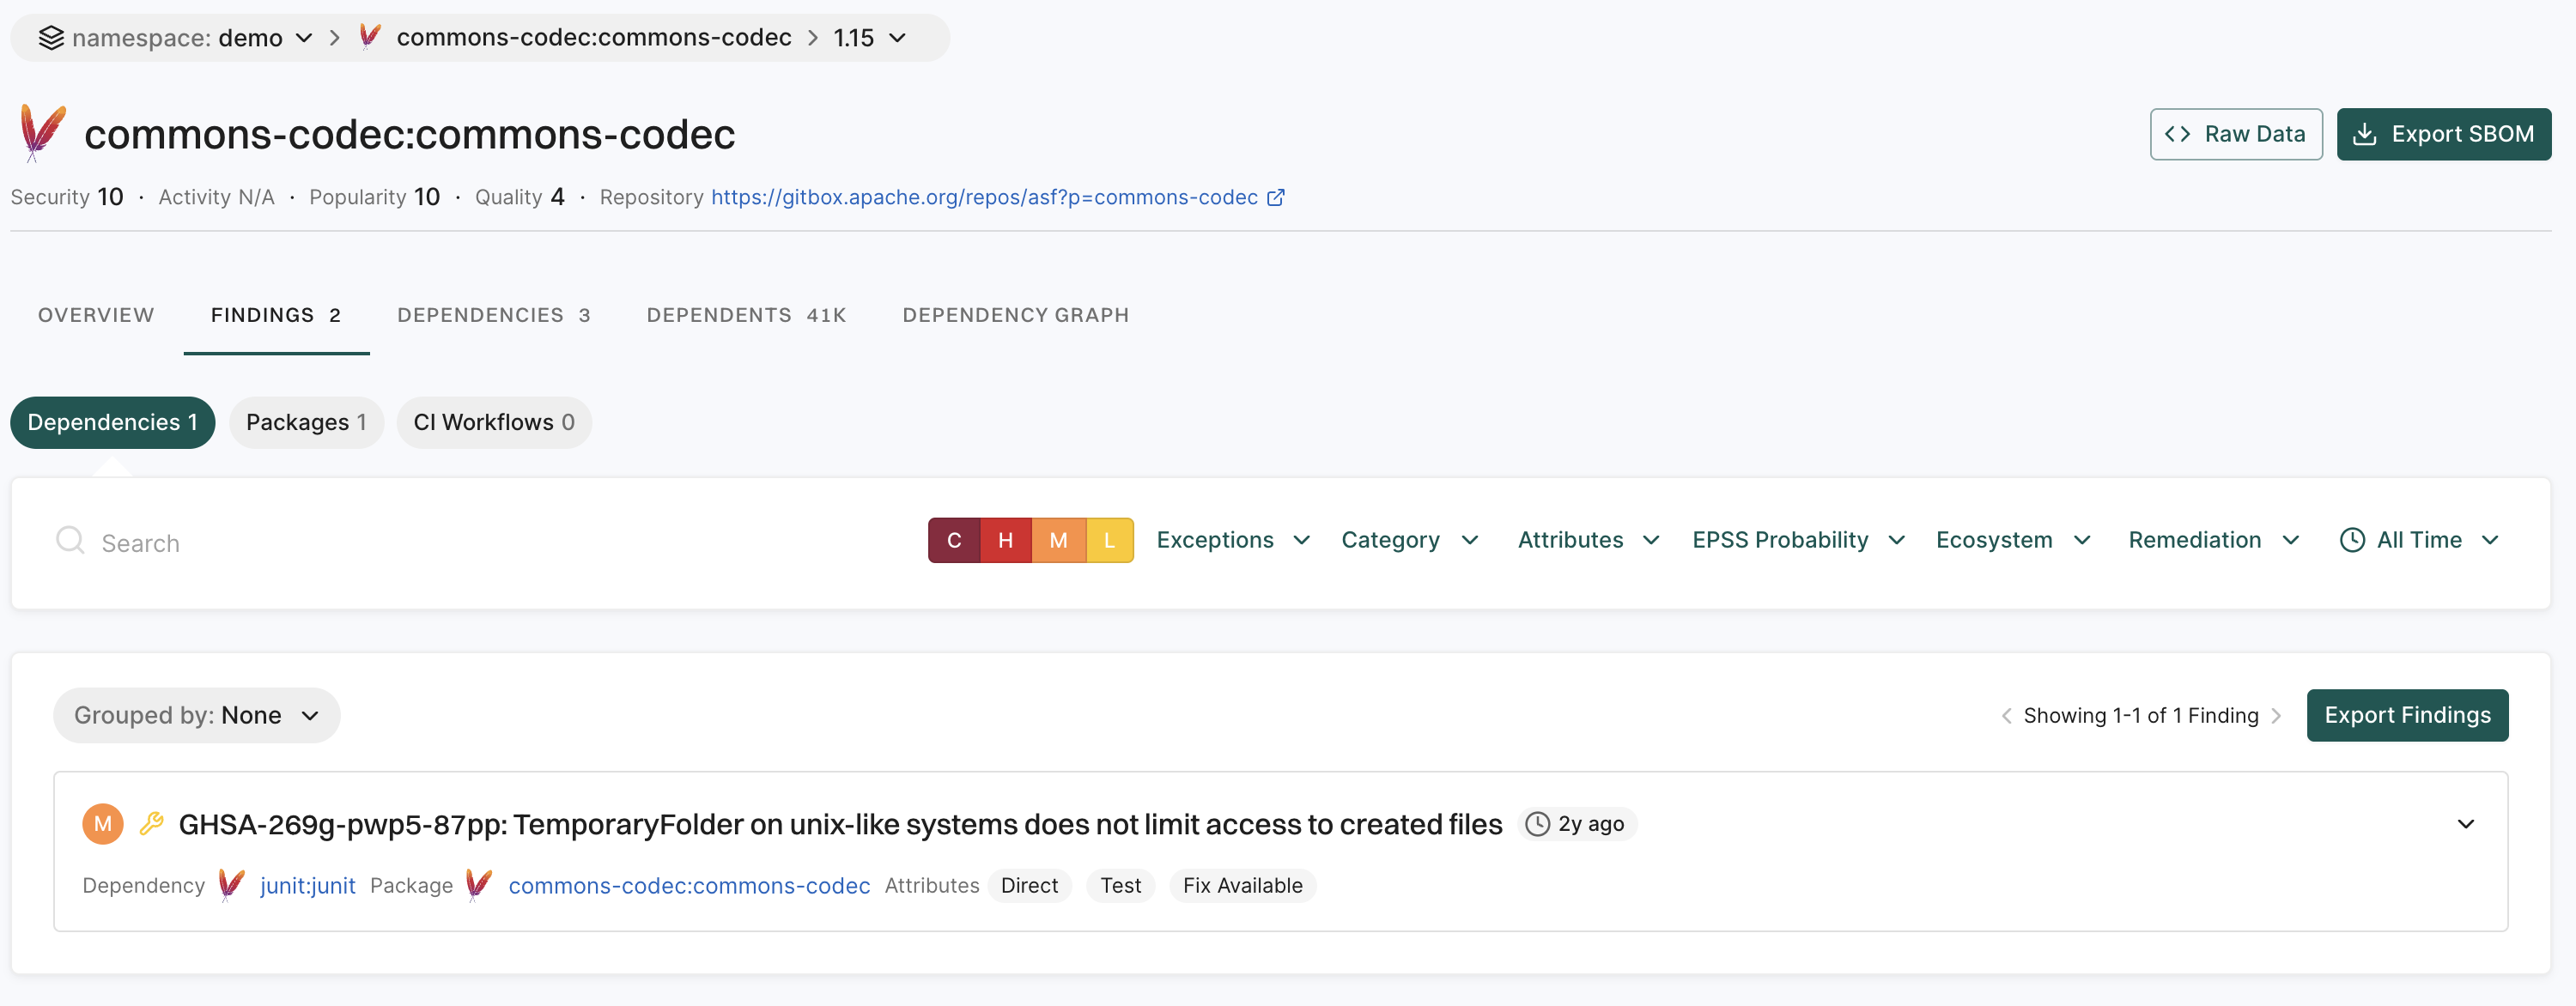
Click the dependency version from the list of dependencies to view the details of the dependency version.
You can view the findings for the dependency version under Findings.
Select Dependencies under Findings to view findings of related dependencies.
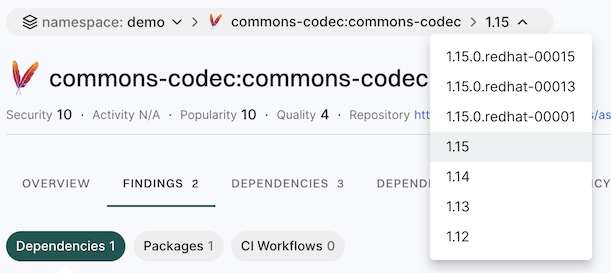
Click Global View to view details of all the versions of the dependency.
You can select the version from the drop-down list to view the details of the selected version.
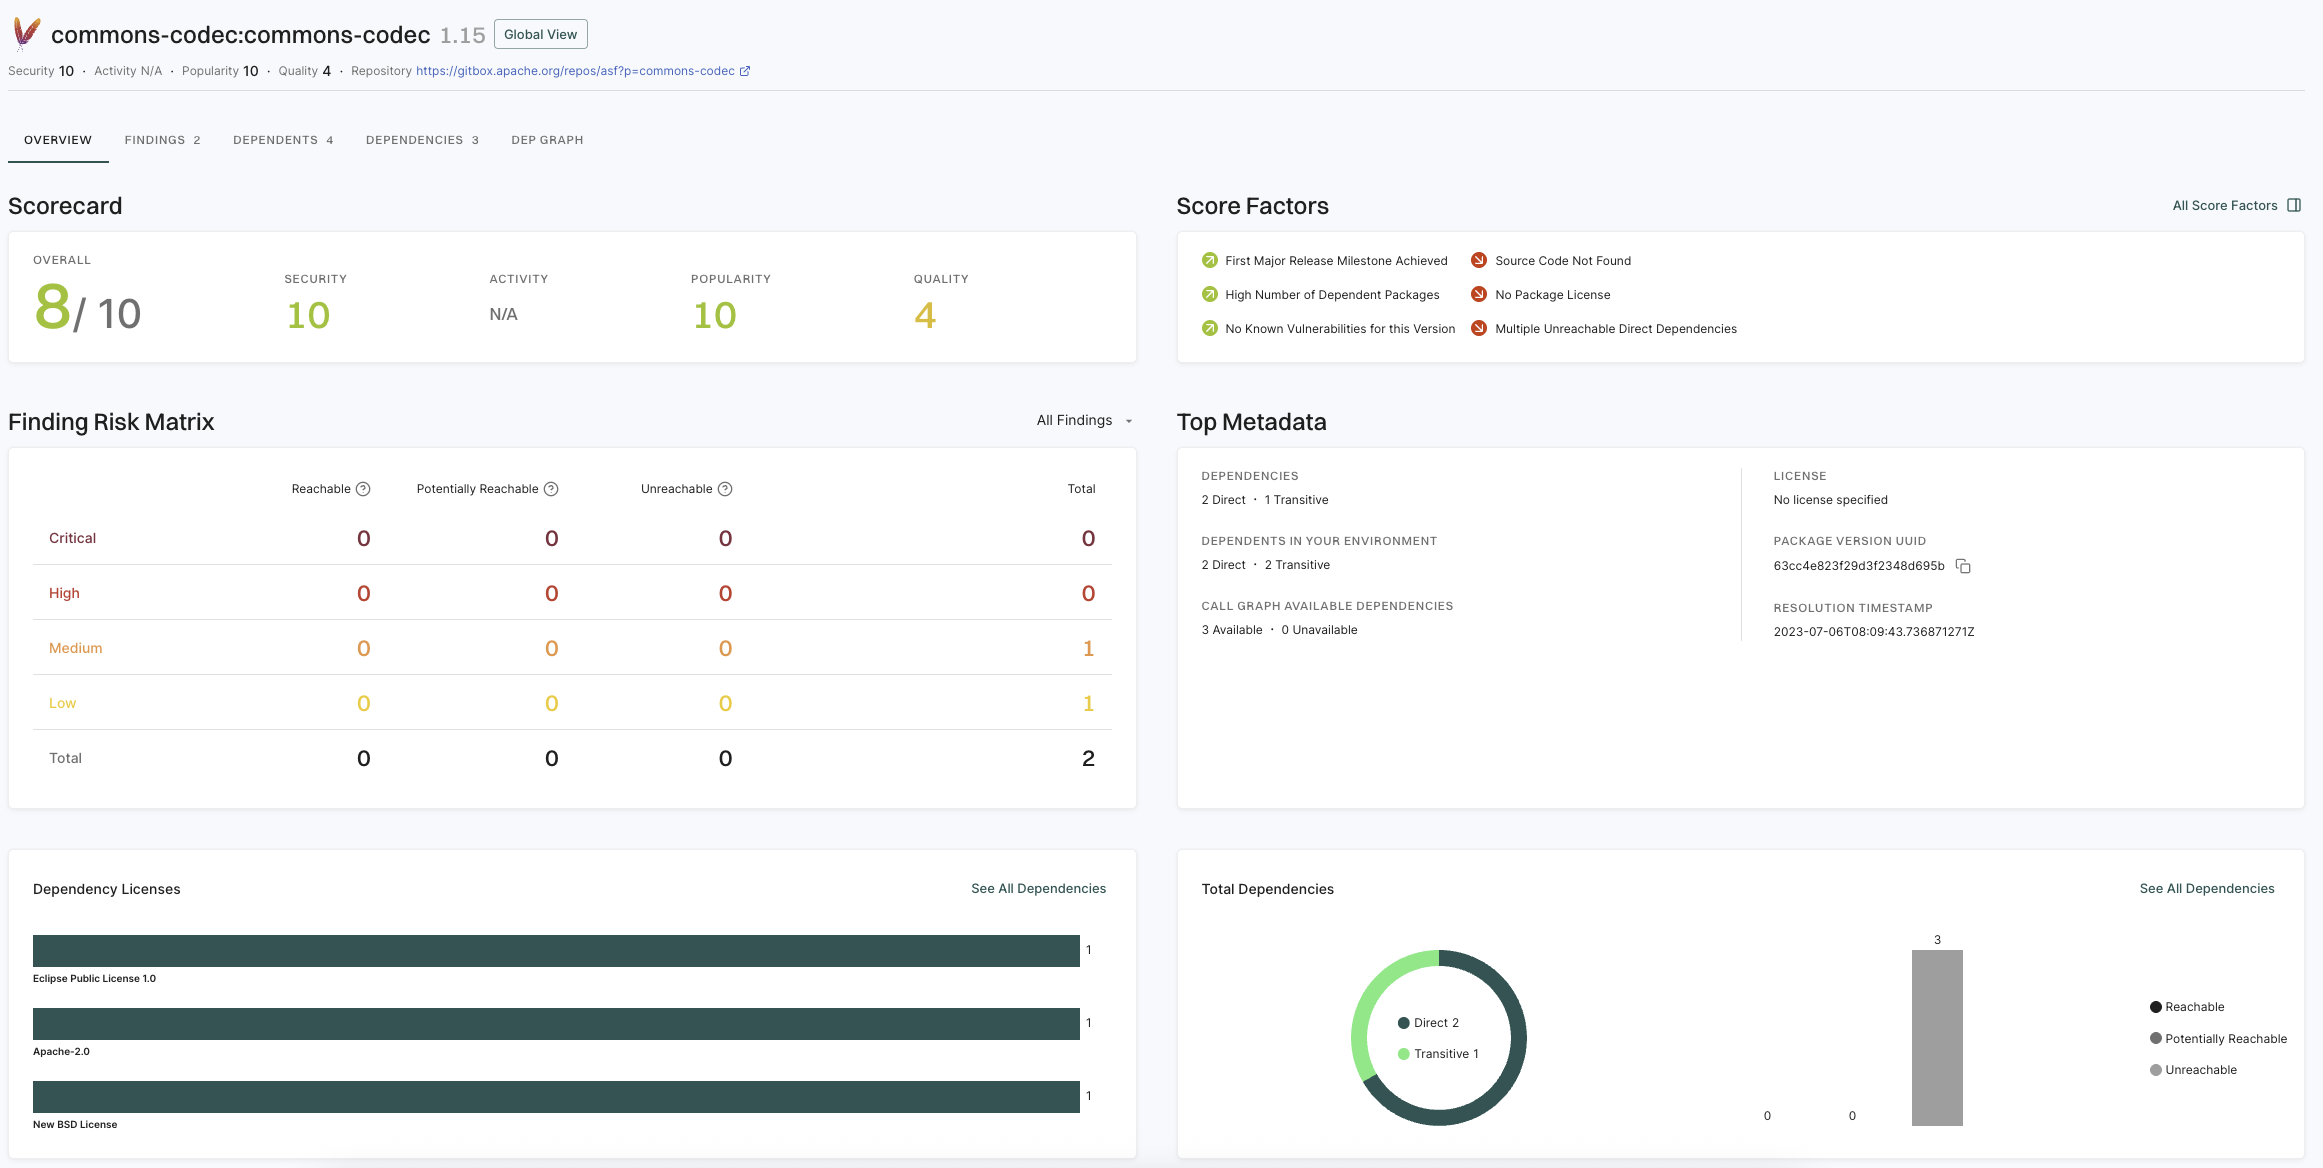
View dependency version overview
Select Overview to view the overview of the selected dependency version.
View dependent projects
Select Dependents to view the projects that depend on the selected dependency version.
View dependencies of the selected dependency version
Select Dependencies to view the dependencies of the selected dependency version.
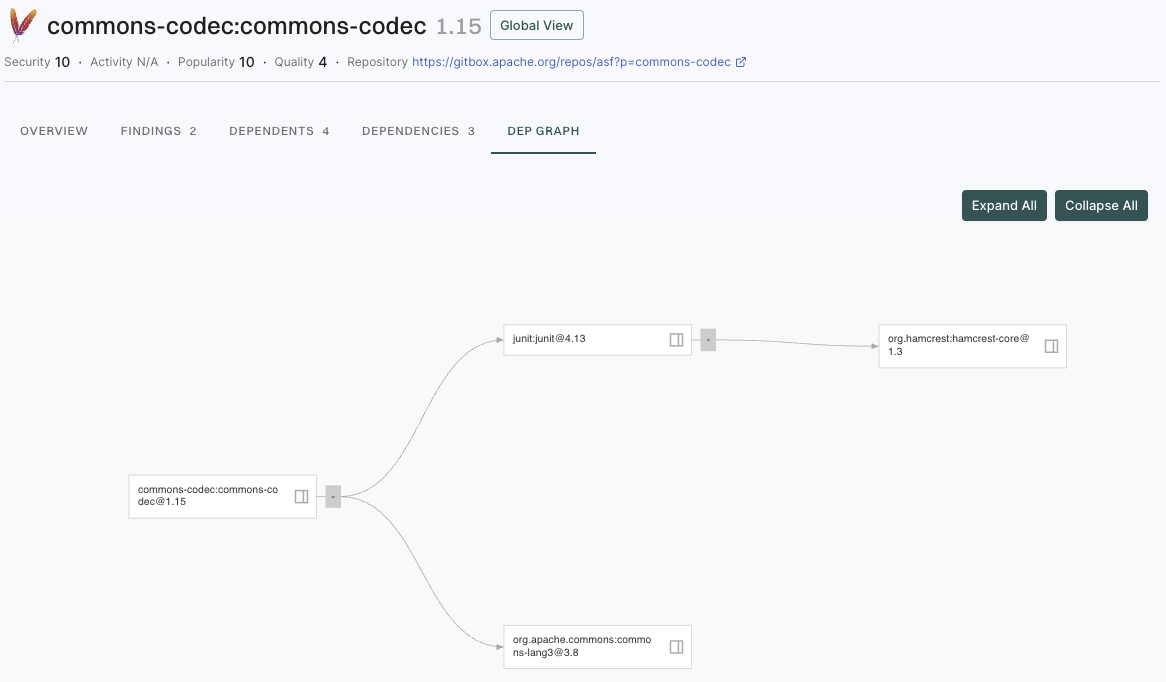
View dependency graph
Select Dependency Graph to view the dependency graph of the selected dependency version. Use the search bar to locate specific dependencies within the graph.
Use the following options to filter the dependency graph view:
Severity filter: Filters dependencies by the severity level of their findings such as Critical, High, Medium, or Low.
Ecosystem: Filters dependencies by their package ecosystem such as Maven, npm, PyPI, Go, or NuGet.
Hide Unreachable: Hides dependencies that are not reachable in your code to help you focus on dependencies that are actively used.
Hide Without Findings: Hides dependencies that don’t have any security findings, so you can focus on dependencies that require attention.
Export dependencies
You can export the list of dependencies to a CSV file for offline analysis.
Select Dependencies from the left sidebar.
Use the search bar to enter search criteria.
Click Add Filter to filter out dependencies based on specific criteria.
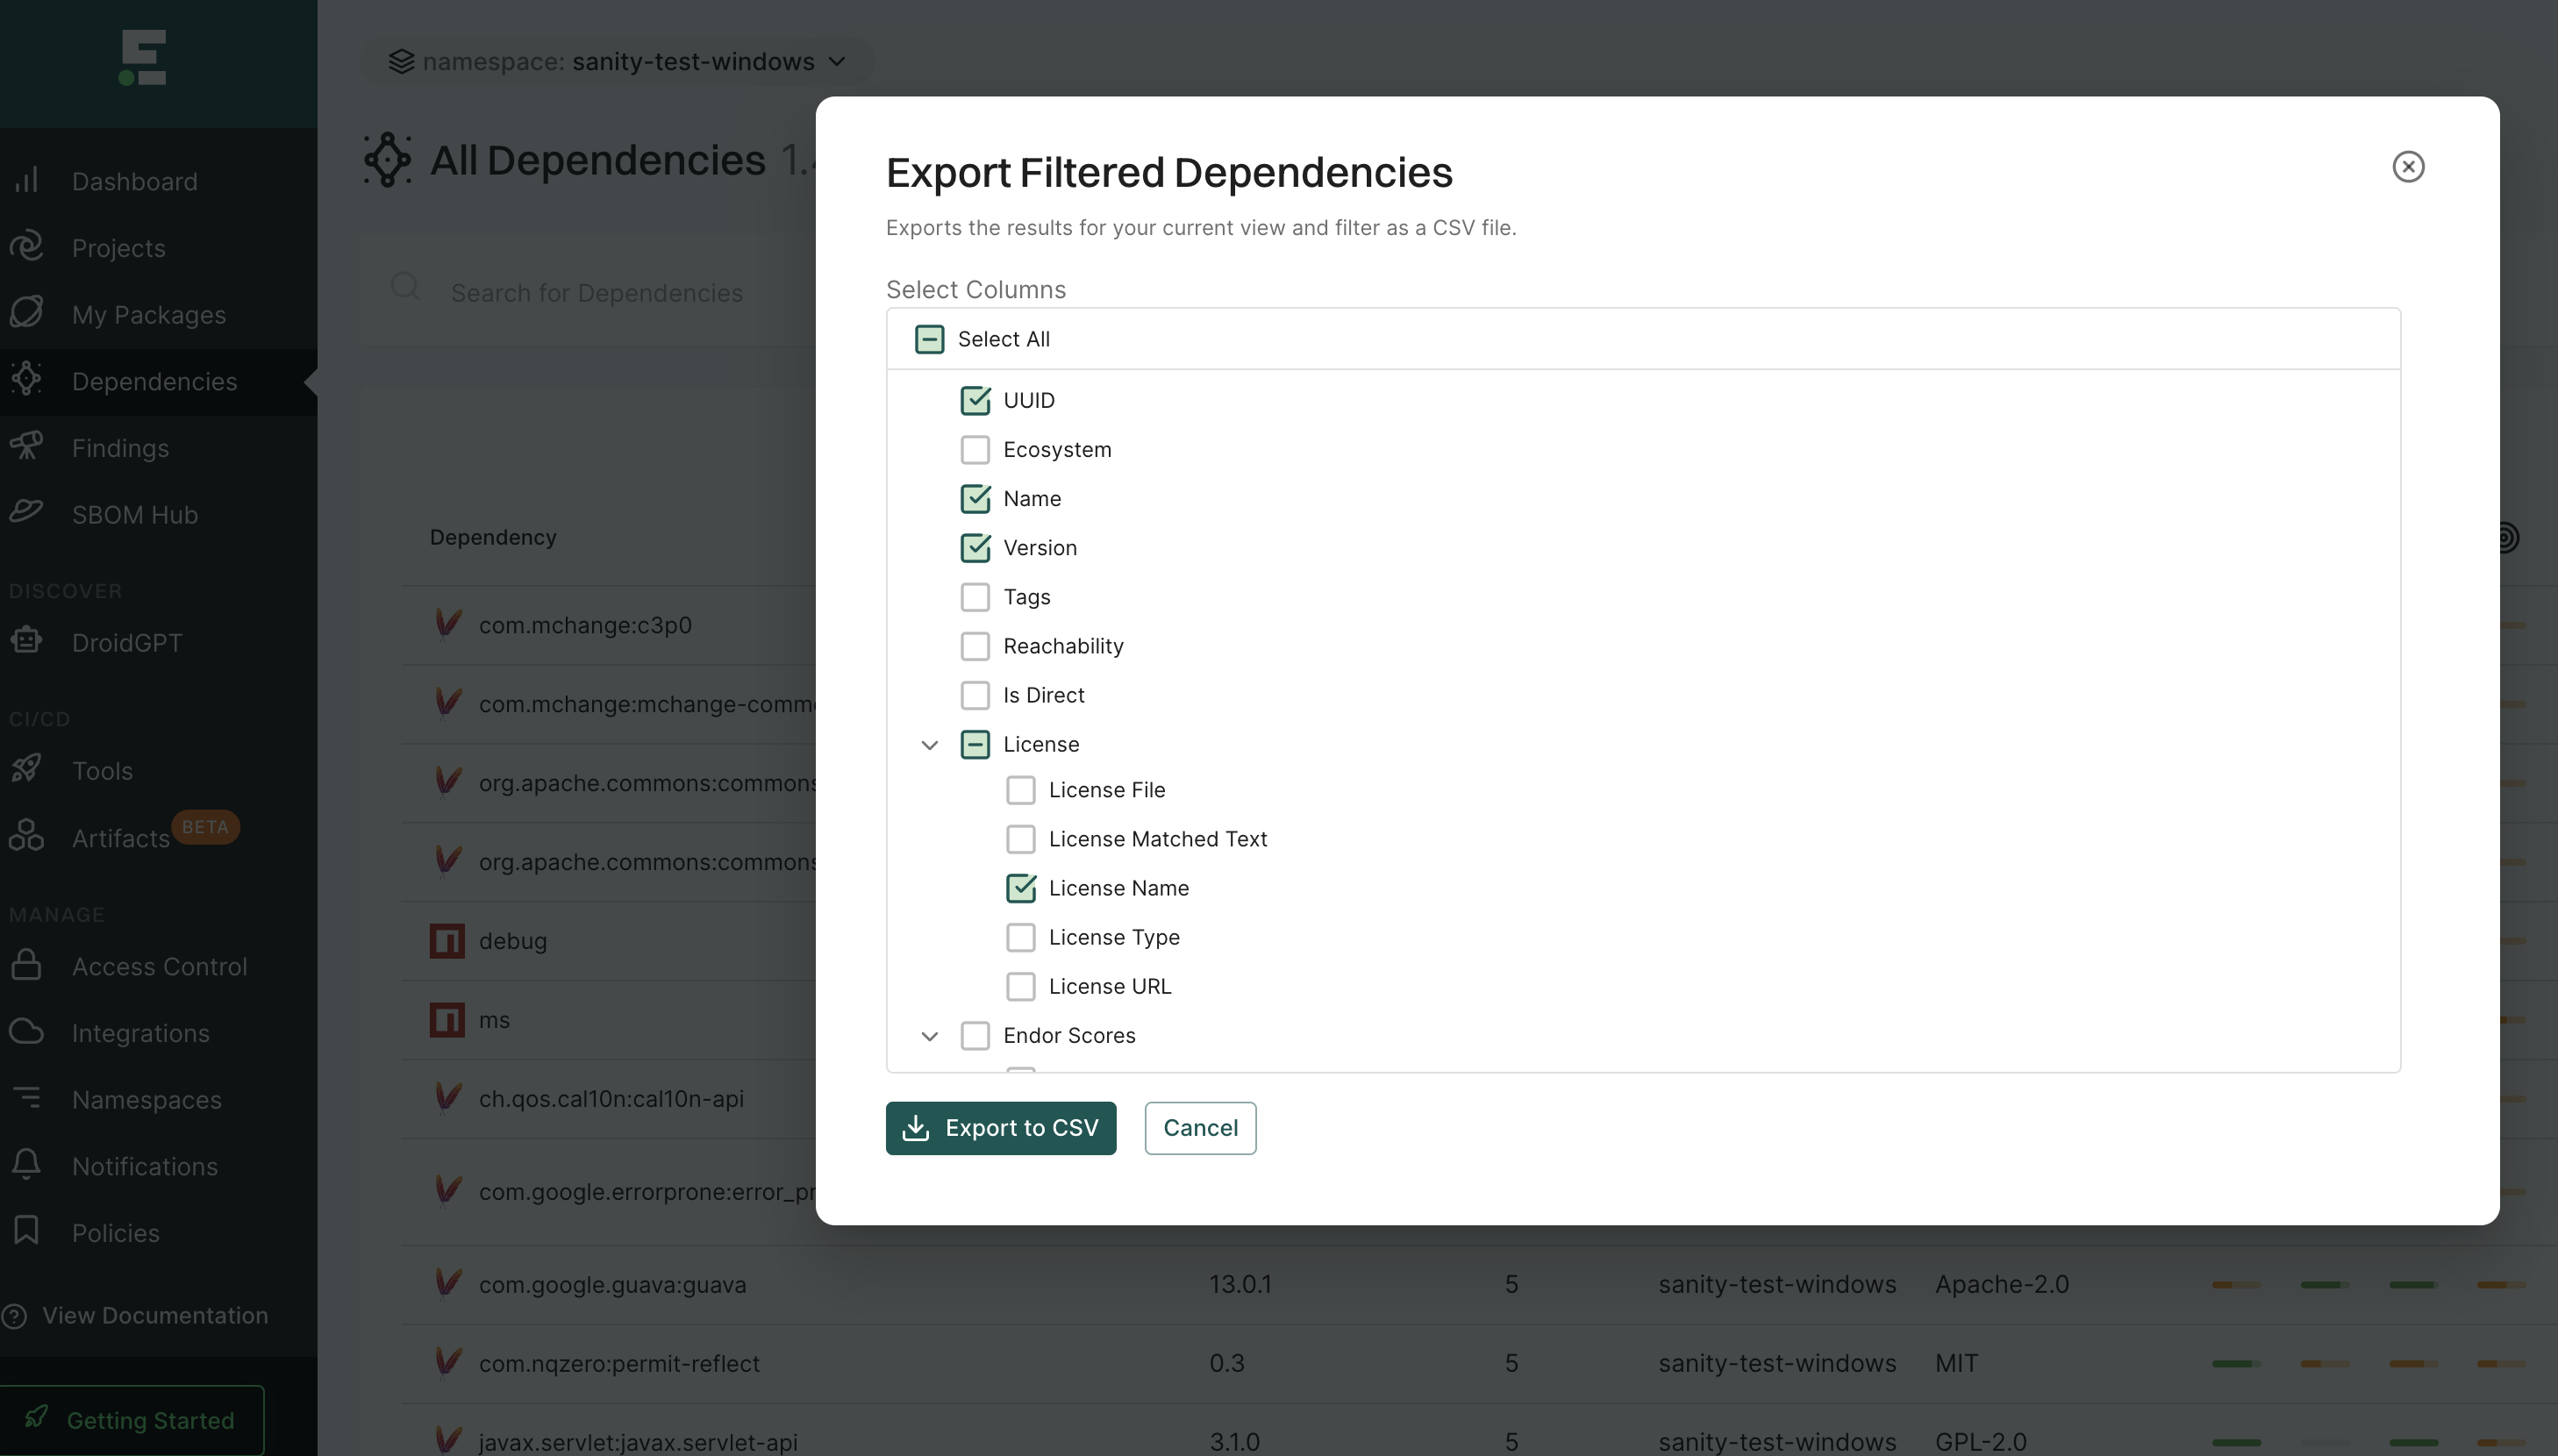
Click Export Dependencies to export the list of filtered dependencies in a CSV file for offline analysis.
You can choose the columns to include in your CSV file from the following fields.
UUID of the project
Ecosystem of the project such as Maven, npm, PyPI, Go, NuGet, or more
Name of the dependency
Version of the dependency
Tags associated with the dependency
Reachability of the dependency
Is Direct which indicates if the dependency is direct or transitive
License information such as file, name, type, URL, and license text from the source code that aligns with a known license’s text
Endor scores such as activity, quality, popularity, and security scores
Package version name that indicates the fully qualified name of the root package version
Package version UUID that indicates the root package’s UUID
Project name that indicates the qualified package name of the root package
Project UUID that indicates the UUID of the root package
Endor patch that indicates if the dependency has an Endor patch available
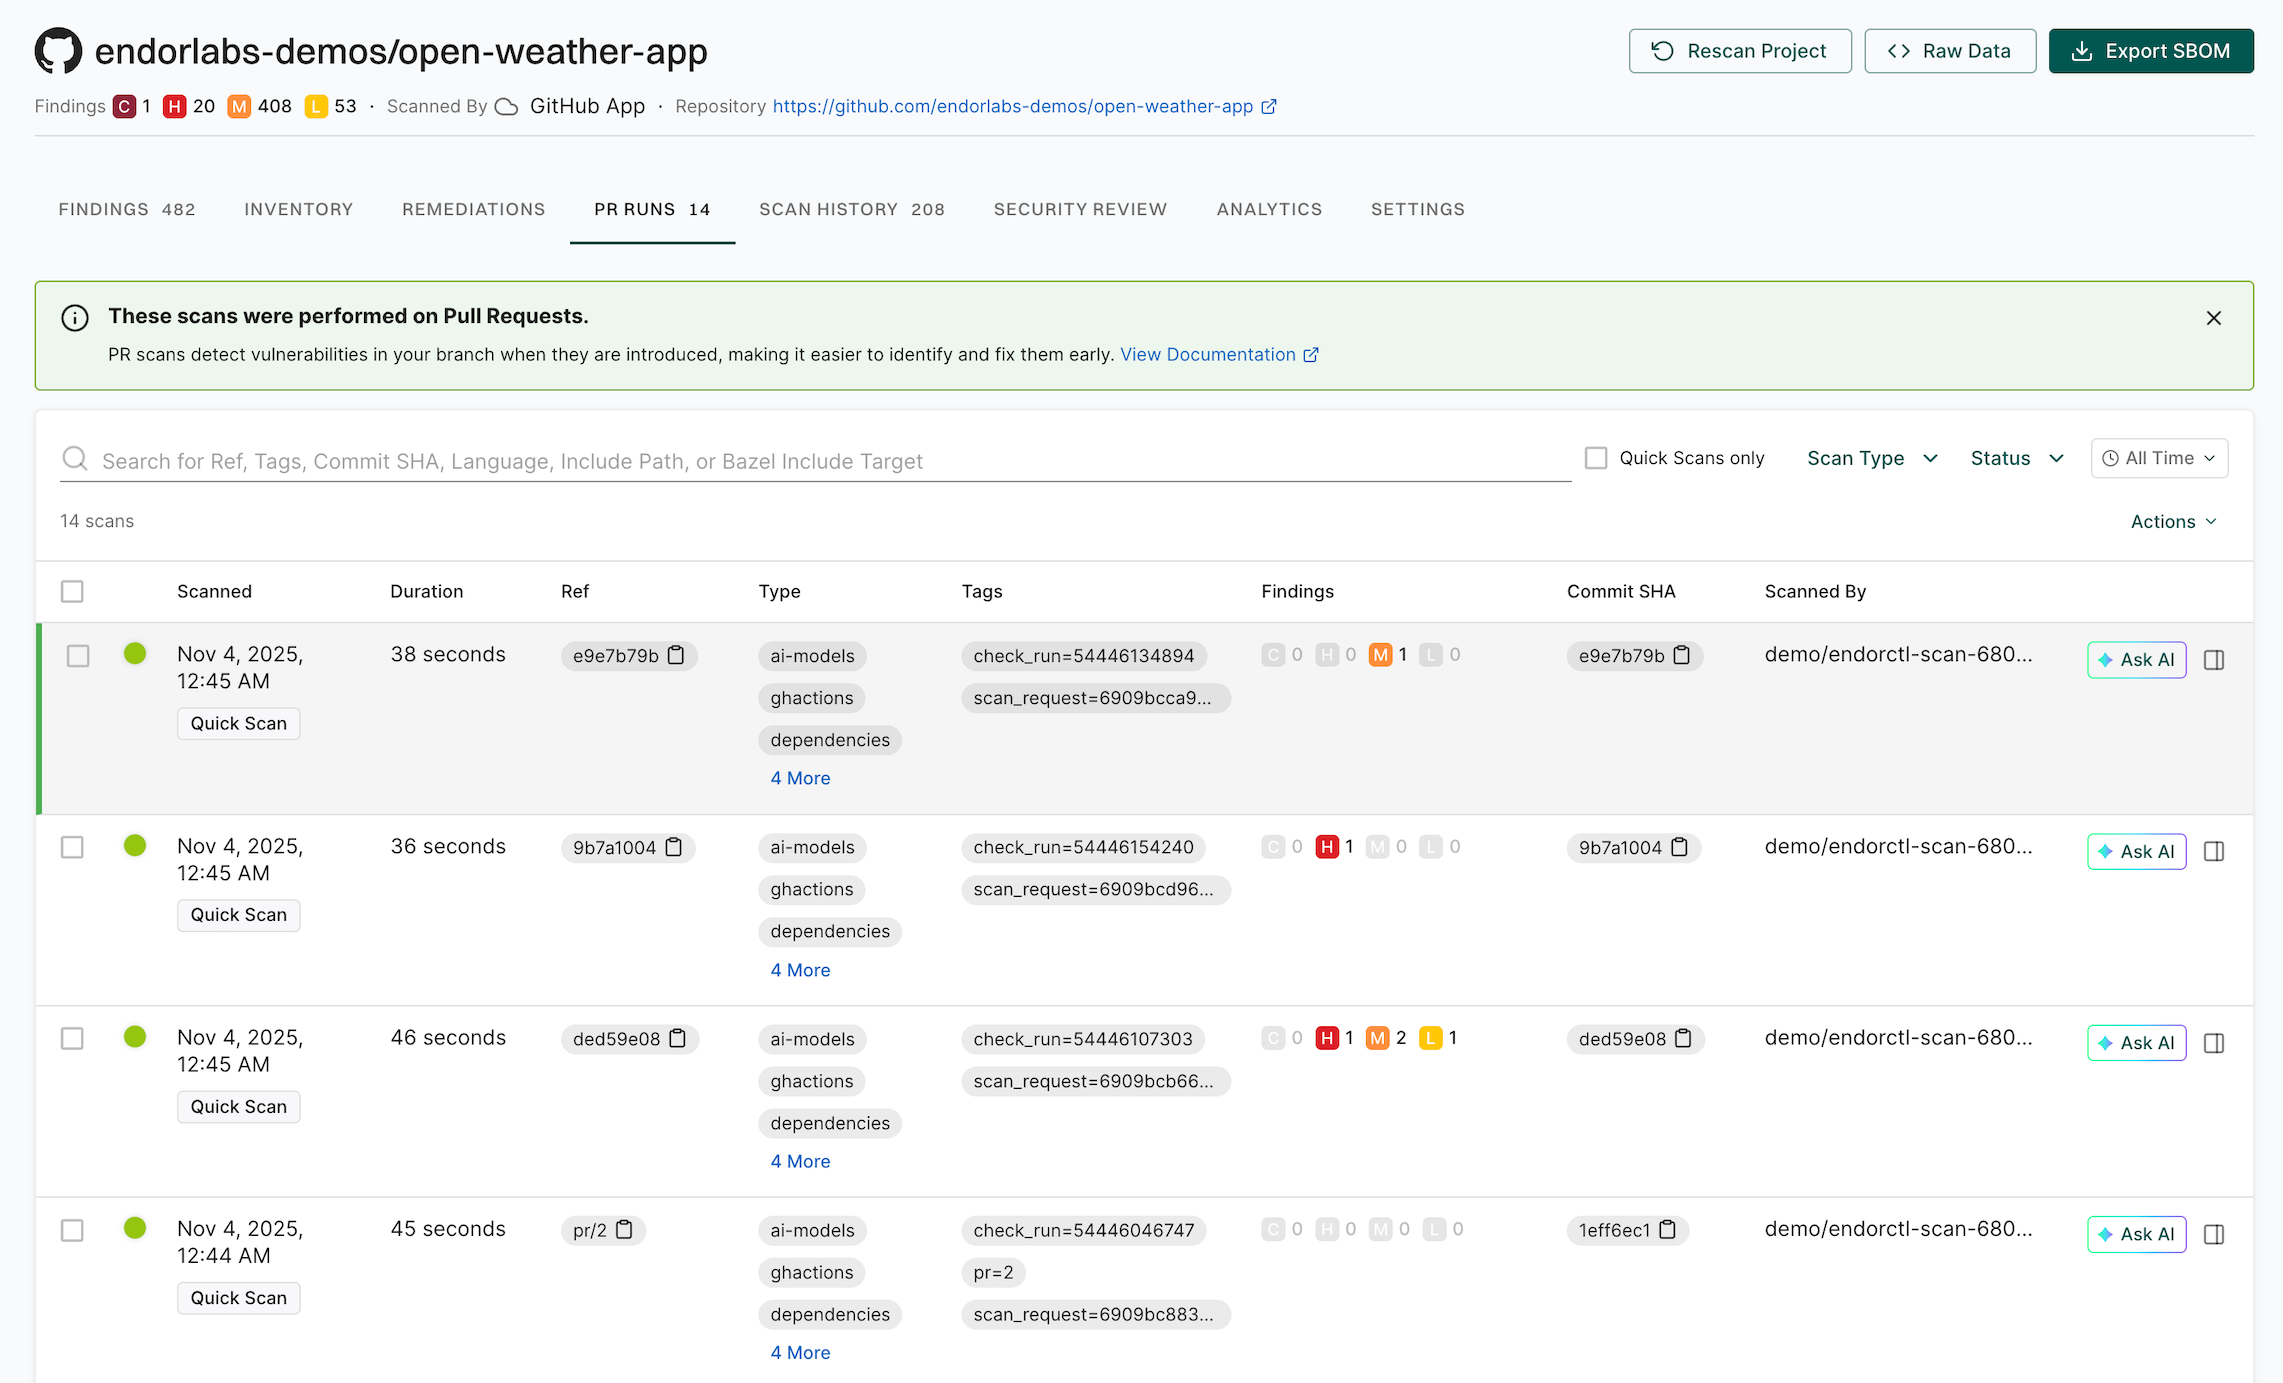
PR runs
PR runs provide a detailed view of security scans performed on pull requests before they are merged. They help you assess the security impact of code changes and identify issues early in the development cycle. You can use them to verify merge readiness, ensure compliance, and troubleshoot scan failures with full context on vulnerabilities, policy violations, and dependency issues.
Select Projects from the left sidebar.
Search for and select a project to review.
Select PR RUNS to review the past scans.
List of Scans: View all past PR scans, including details such as the scan time, duration, scan type, and tags.
Ref: The Git reference identifying the scanned commit or branch. For Endor Labs SCM Apps, pre-merge pull request scans use a named ref (for example, pr/1259), while merge commit scans use a commit SHA.
Findings Summary: Review the number of security findings, categorized by severity: Critical, High, Medium, or Low.
Commit Details: Each scan is linked to a specific commit SHA, allowing users to track security issues to specific code changes.
Scanned By: Identifies the user or system that initiated the scan.
Filtering & Search: You can filter scans by status, scan type, and time range. You can search by tags, commit SHA, or specific include or exclude file paths.
For example, you can select Container as a scan type from the dropdown list.
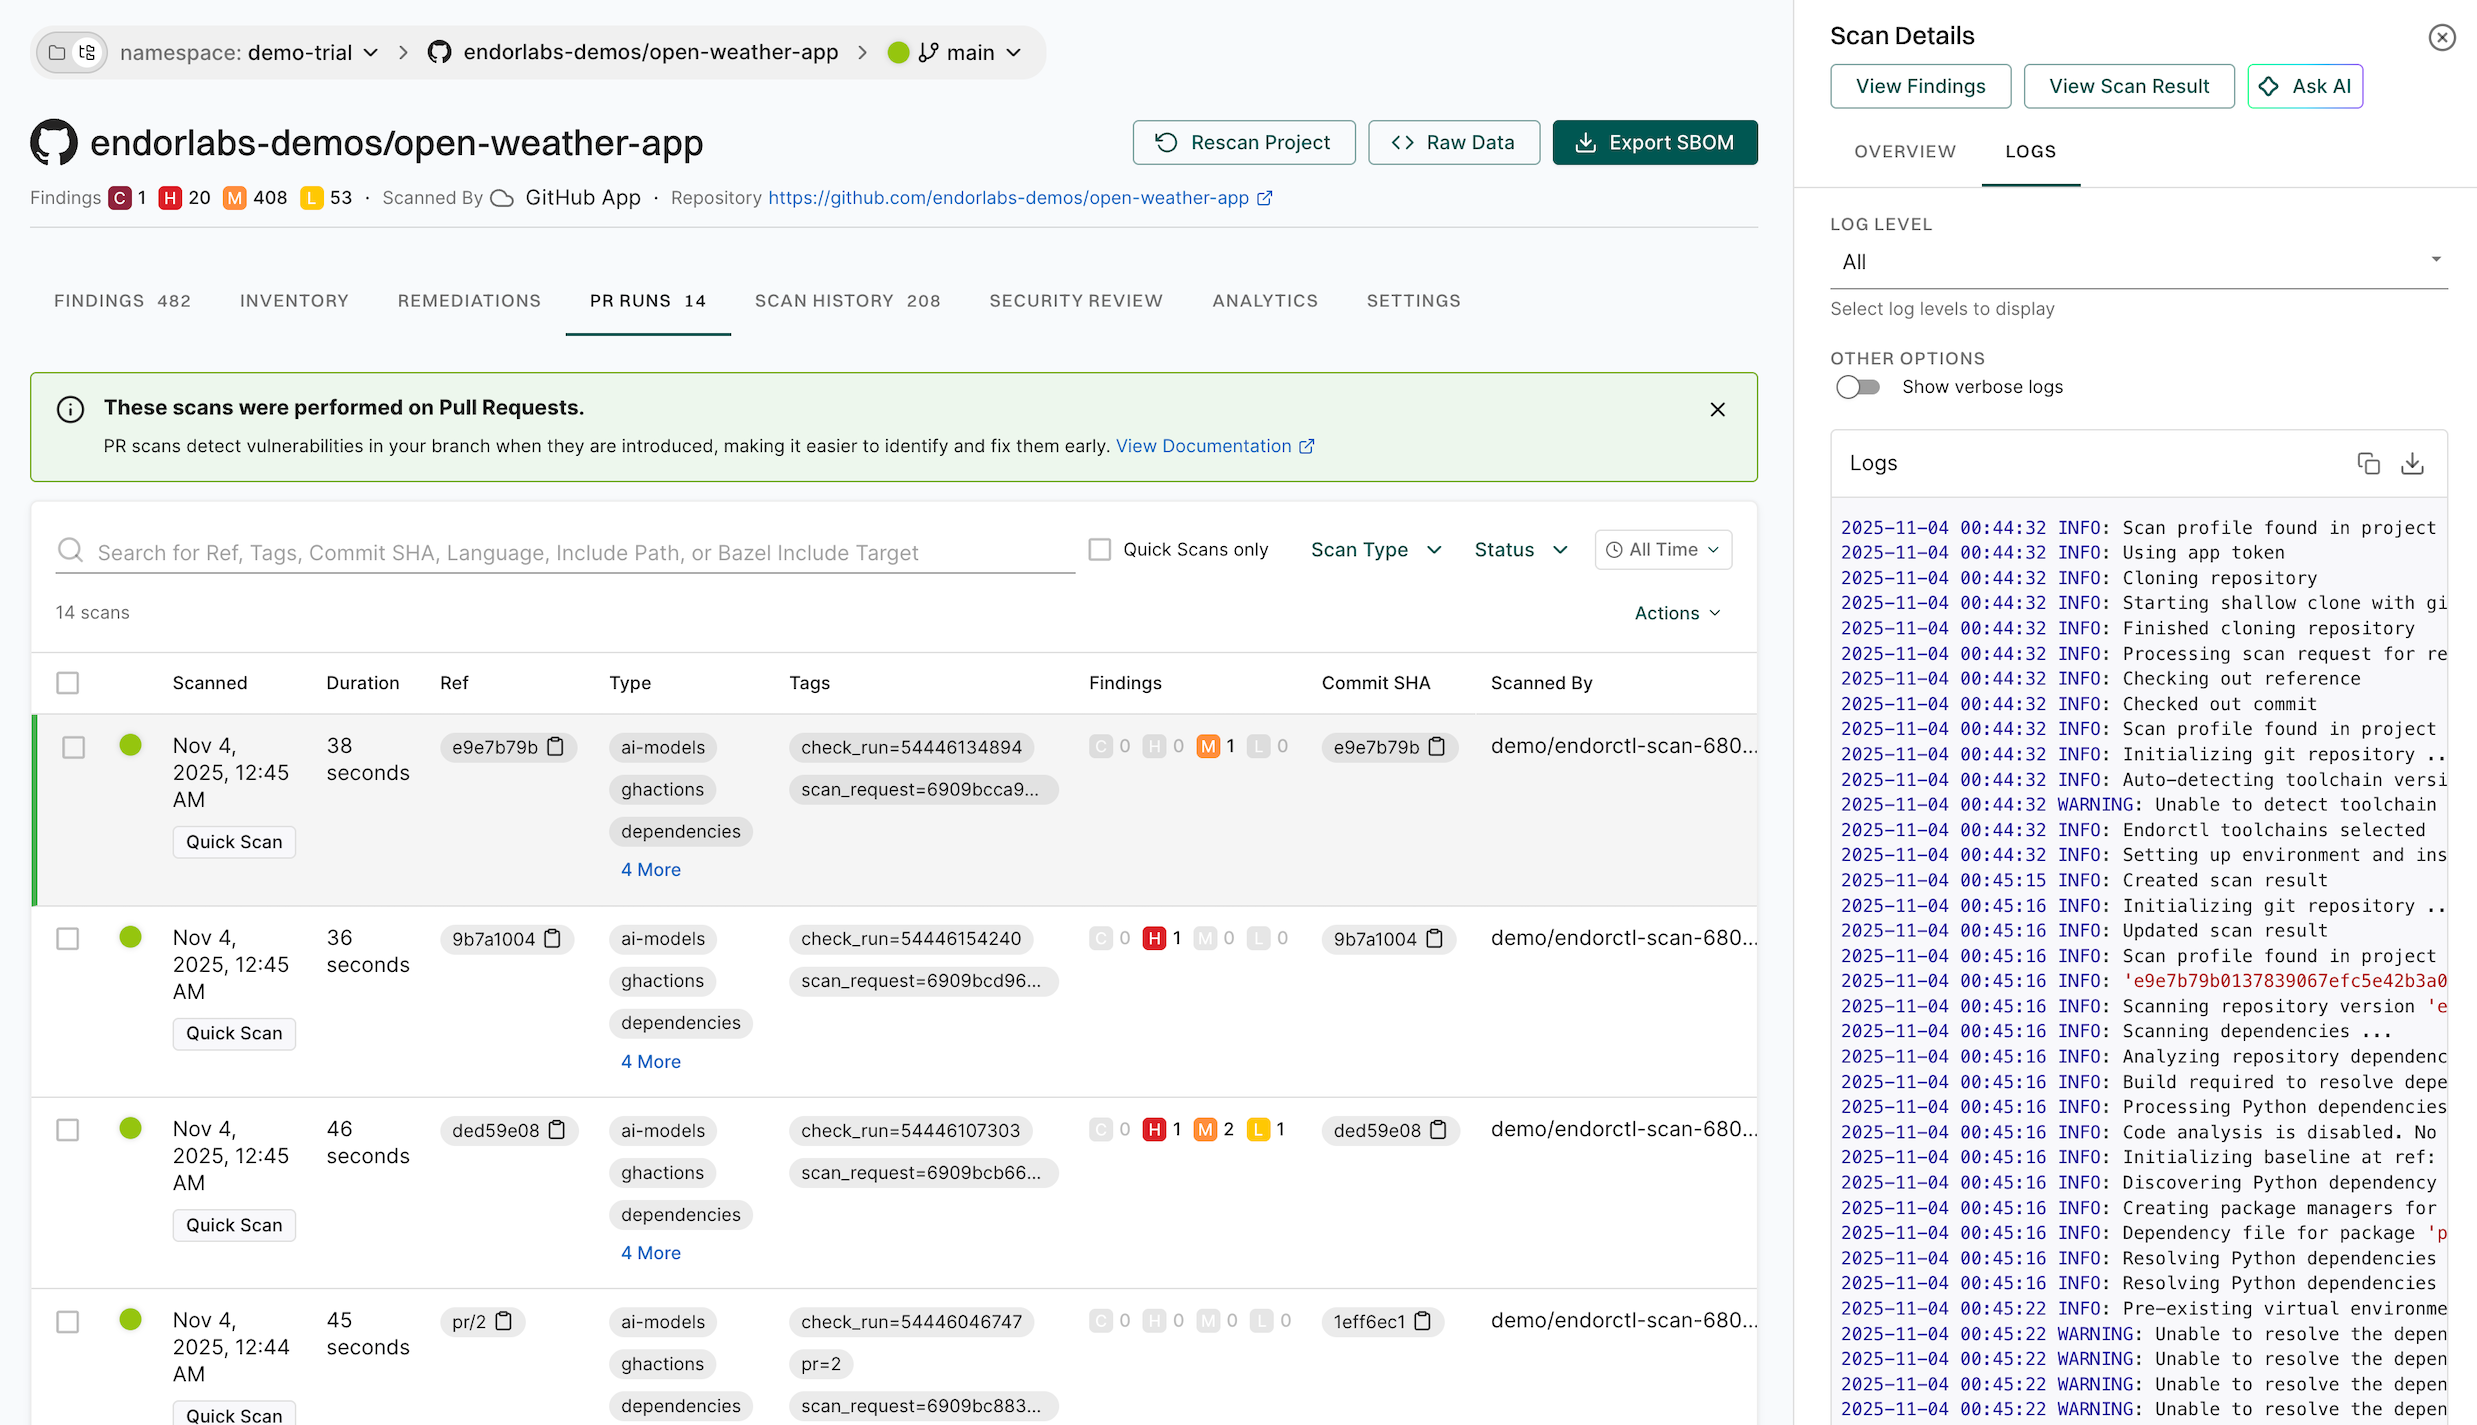
Select a record to view general information about the scan or its logs.
View Findings: Displays security findings associated with the scan. Findings are not recorded in case of scan failures.
View Scan Result: Displays scan information, issue logs with error details, and additional scan data.
Overview: Displays general scan information such as the scan status, result UUID, detected programming languages, system details, and versions of key development tools used in the environment.
Issues: Displays additional errors and warnings from the scan.
Logs: Monitor scan logs, even while scans are running, and filter by severity level, with selectable log severity from Emergency, Alert, Critical, Error, Warning, Notice, Info, or Debug for in-depth debugging and policy evaluations.
You can access scan logs and toolchain details for projects onboarded through Endor Labs cloud using the GitHub, GitLab, or Azure DevOps Apps. The log levels in the selected scan result determine the available log severities.
SBOM
A complete and accurate inventory of all first-party and third-party components is essential for risk identification. A Software Bill of Materials (SBOM) is a document that provides transparency into the software components of an application.
SBOMs should ideally contain all direct and transitive components and the dependency relationships between them. They should also contain metadata associated with each of these components.
For software producers
Software producers, those who create and sell software, need to be able to provide software transparency through an SBOM to their customers on request to reduce sales cycles, establish trust and sometimes as a regulatory or business requirement.
A Vulnerability Exploitability eXchange (VEX) document conveys the potential risks associated with components that have known vulnerabilities within the specific context of the product.
Software producers may need to, upon request, provide justification for known vulnerabilities and how they impact an application they sell.
Software consumers, or those who use software, need to understand their software inventory holistically. This includes both the software that they create and the software that they purchase.
CycloneDX: A lightweight SBOM standard designed for use in application security contexts
SPDX: An open standard for communicating software bill of material information
Export SBOMs and VEX
To export an SBOM you must first perform a successful endorctl scan. If you haven’t successfully scanned a project see quick start for more information.
Export an SBOM through the Endor Labs user interface
When you export an SBOM at the project level, it includes all the packages in the project and all the package versions. This allows you to combine the SBOMs of multiple packages and versions into a single SBOM. A consolidated SBOM for the project enables quick identification and assessment of vulnerabilities across all software components.
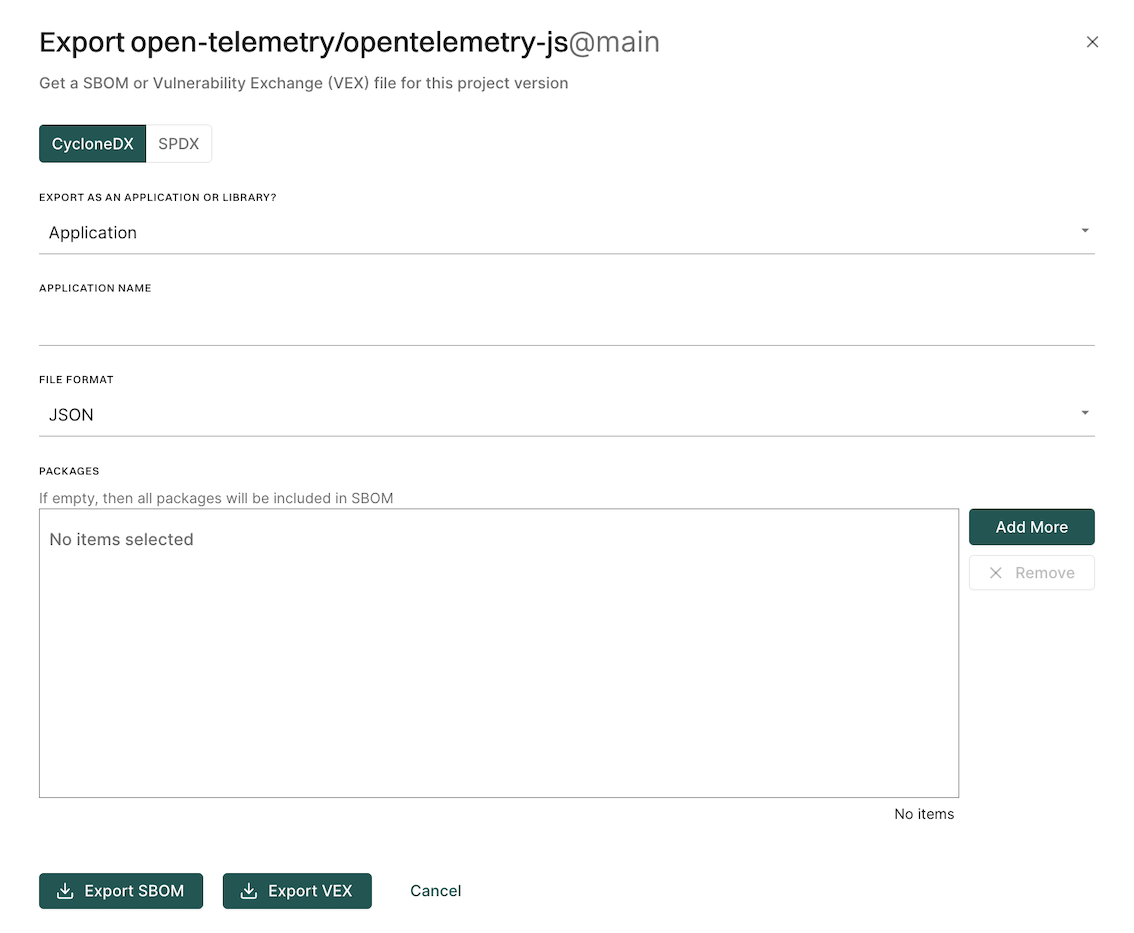
Export an SBOM as CycloneDX
You can export SBOM of the project in the CycloneDX format.
Select Projects from the left sidebar.
Select the project for which to create an SBOM.
Click Export SBOM in the top right-hand corner.
Select CycloneDX.
Choose whether to export as an application or a library.
If you choose to export as an application, enter an application name.
Select the output format and type of SBOM you would like to generate in FILE FORMAT.
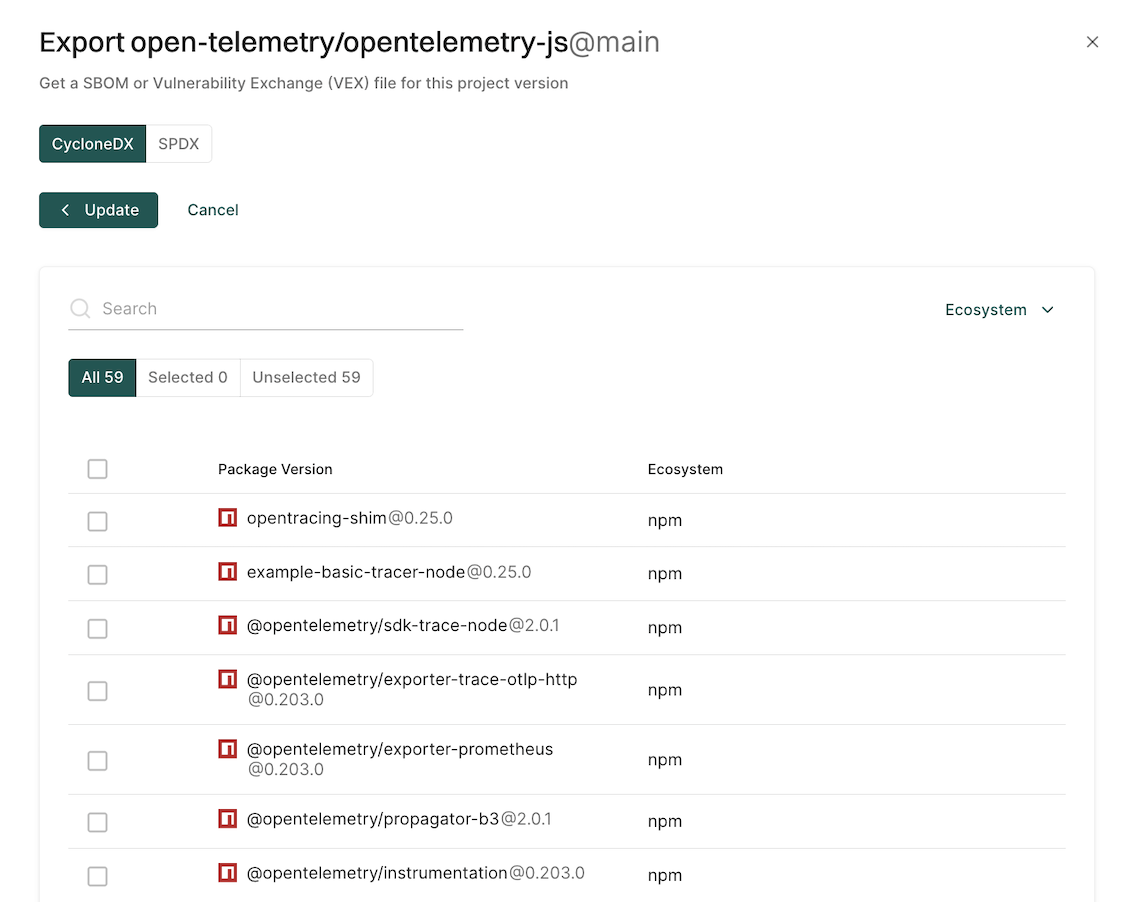
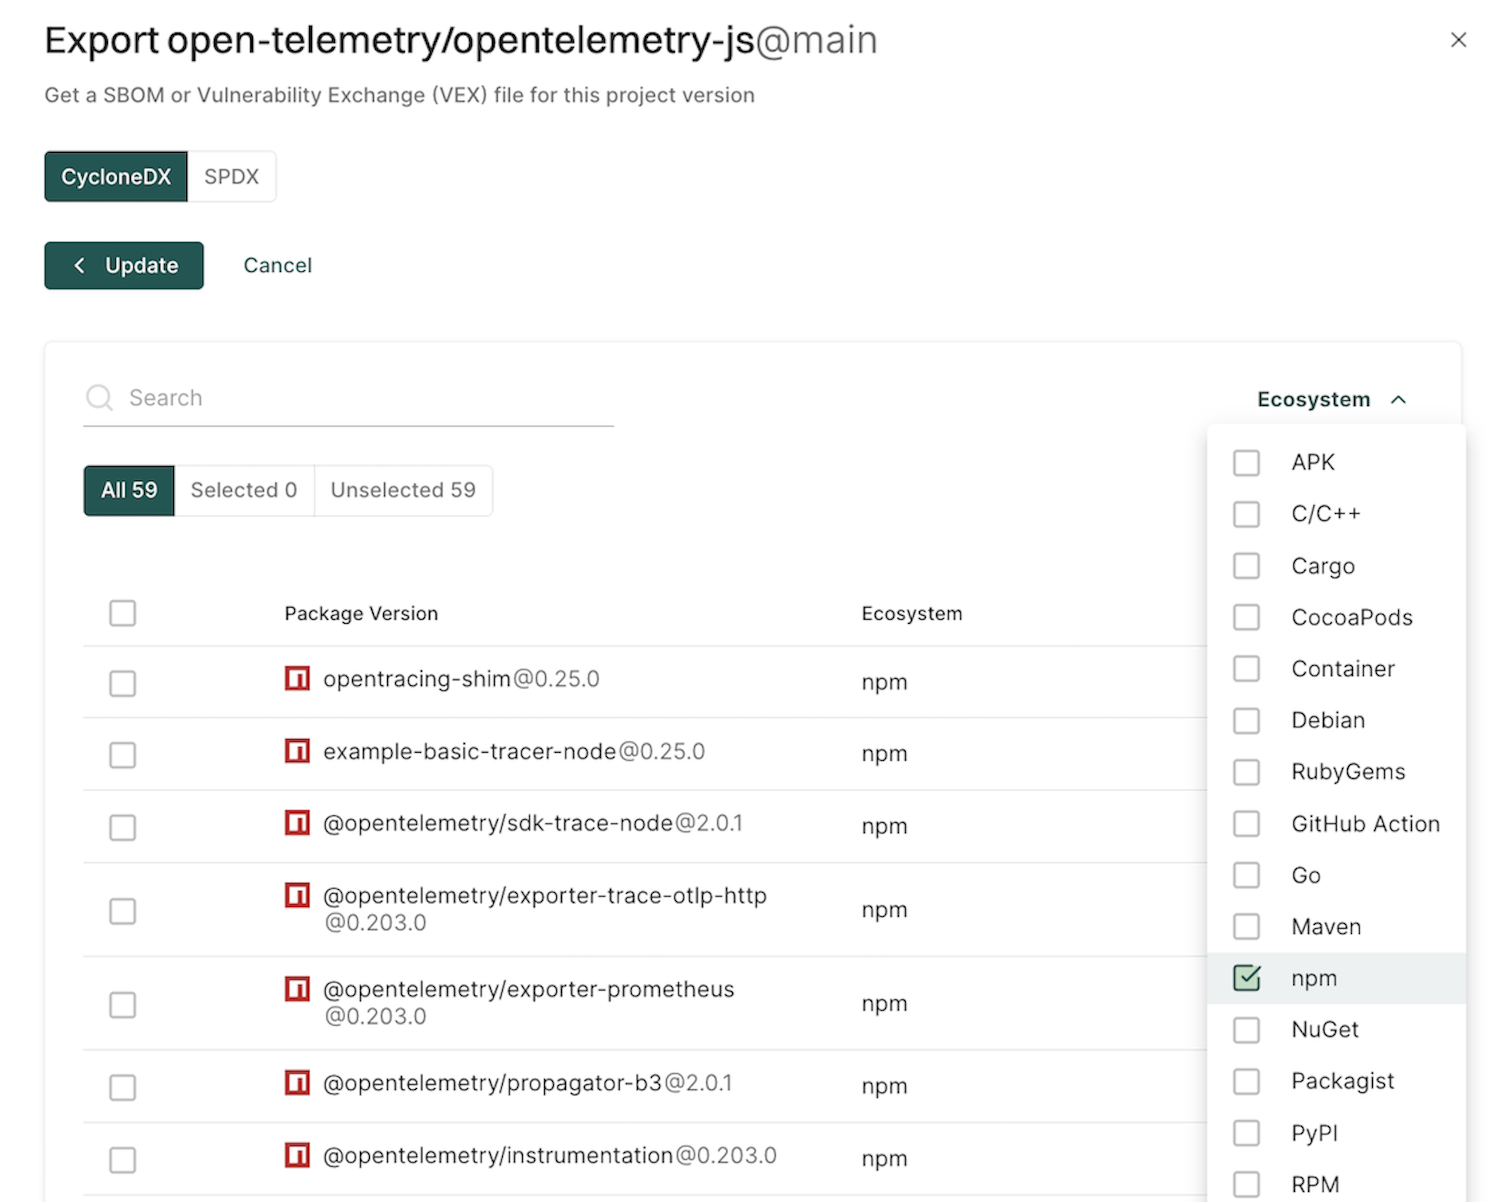
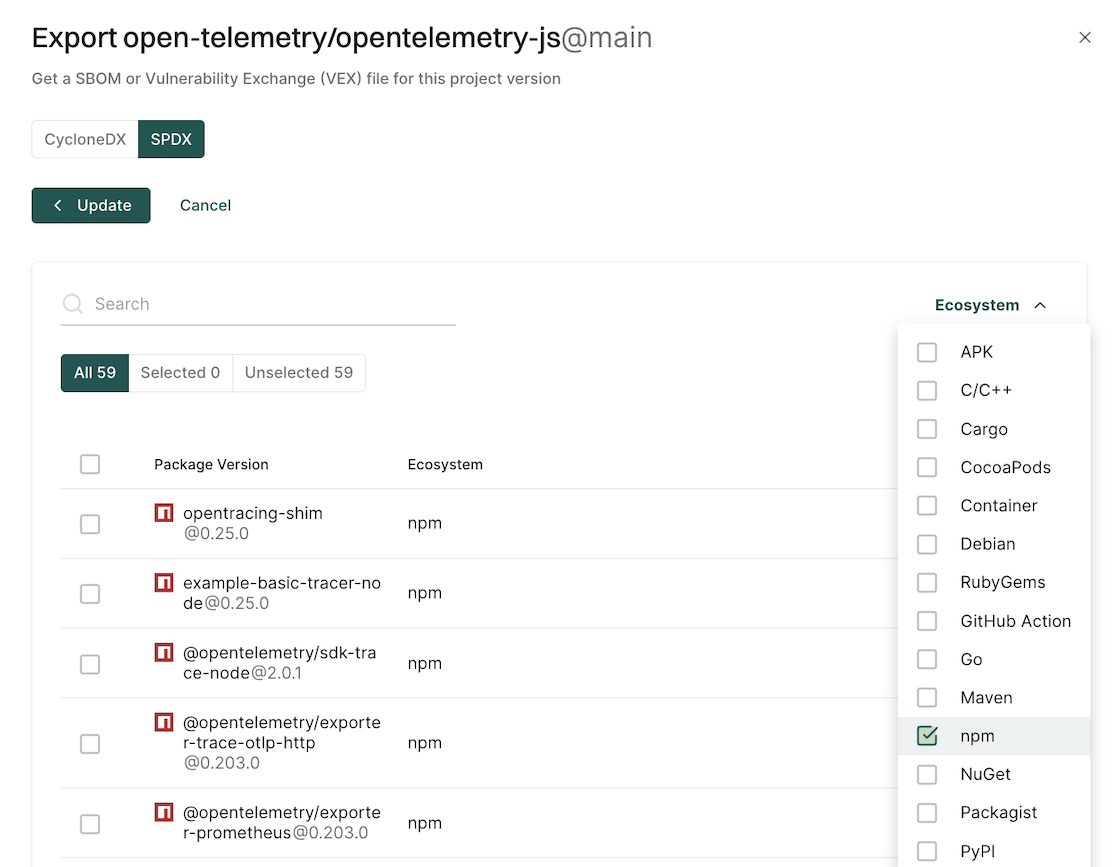
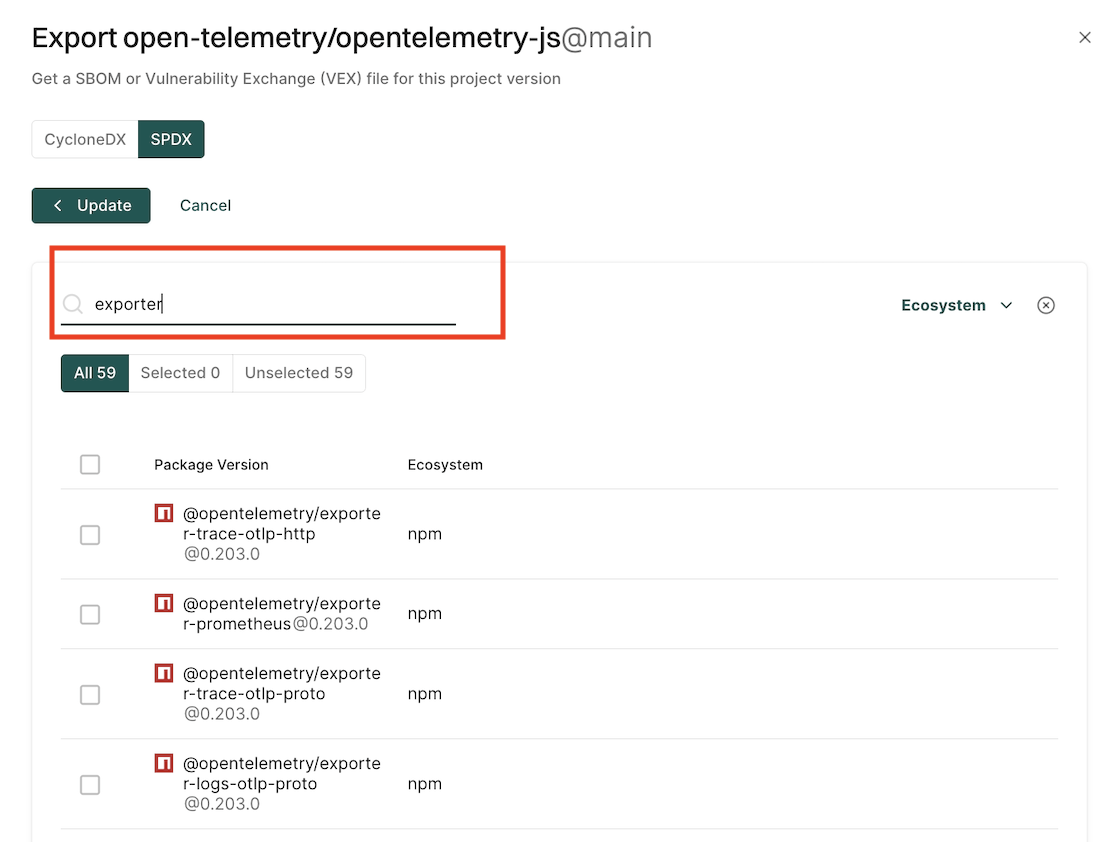
Click Add More to select the packages and package versions you want to include in the SBOM.
If you do not select specific packages, the SBOM will include information for all packages and package versions.
You can filter by ecosystem to select the type of packages to include in the SBOM.
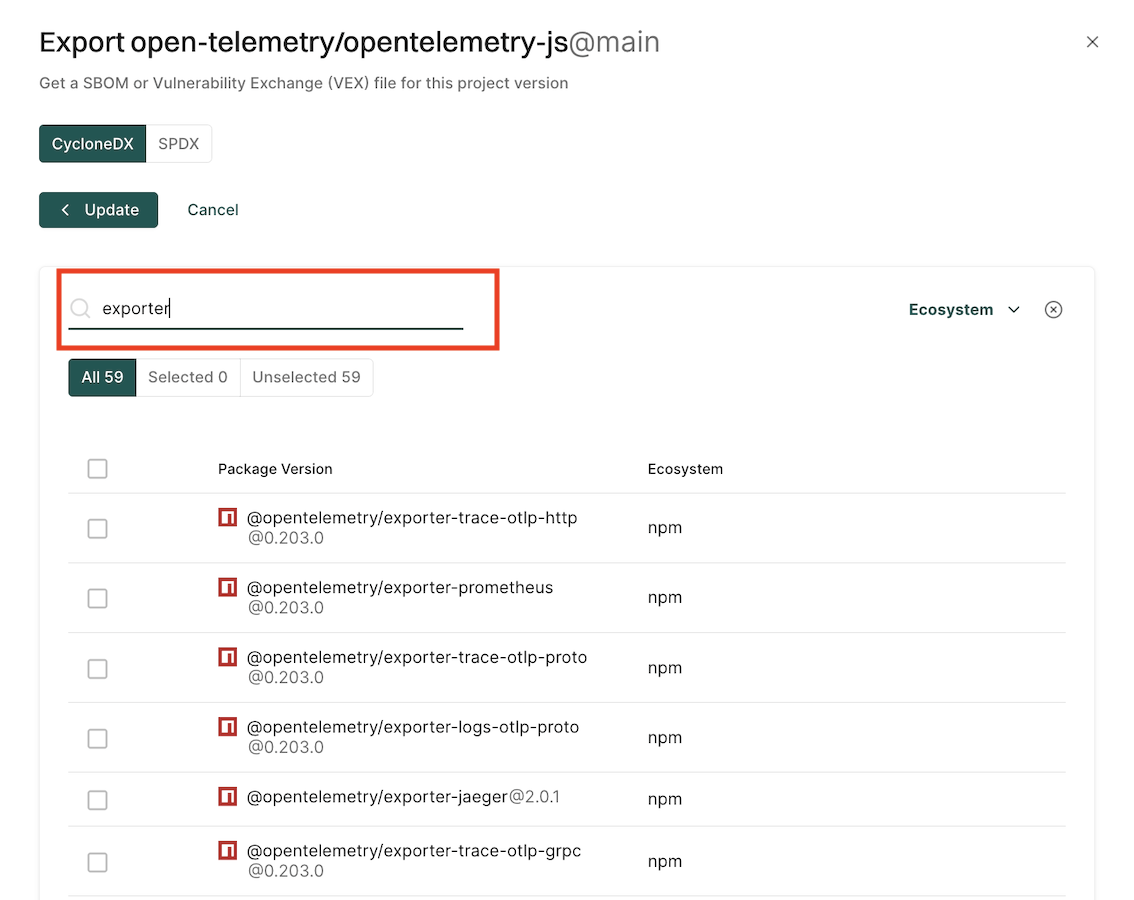
You can also search and select multiple package versions of the same package.
Click Export SBOM.
A file containing the SBOM will download from your browser.
Export an SBOM as SPDX
You can export SBOM of the project in the SPDX format.
Select Projects from the left sidebar.
Select the project for which to create an SBOM.
Click Export SBOM in the top right-hand corner.
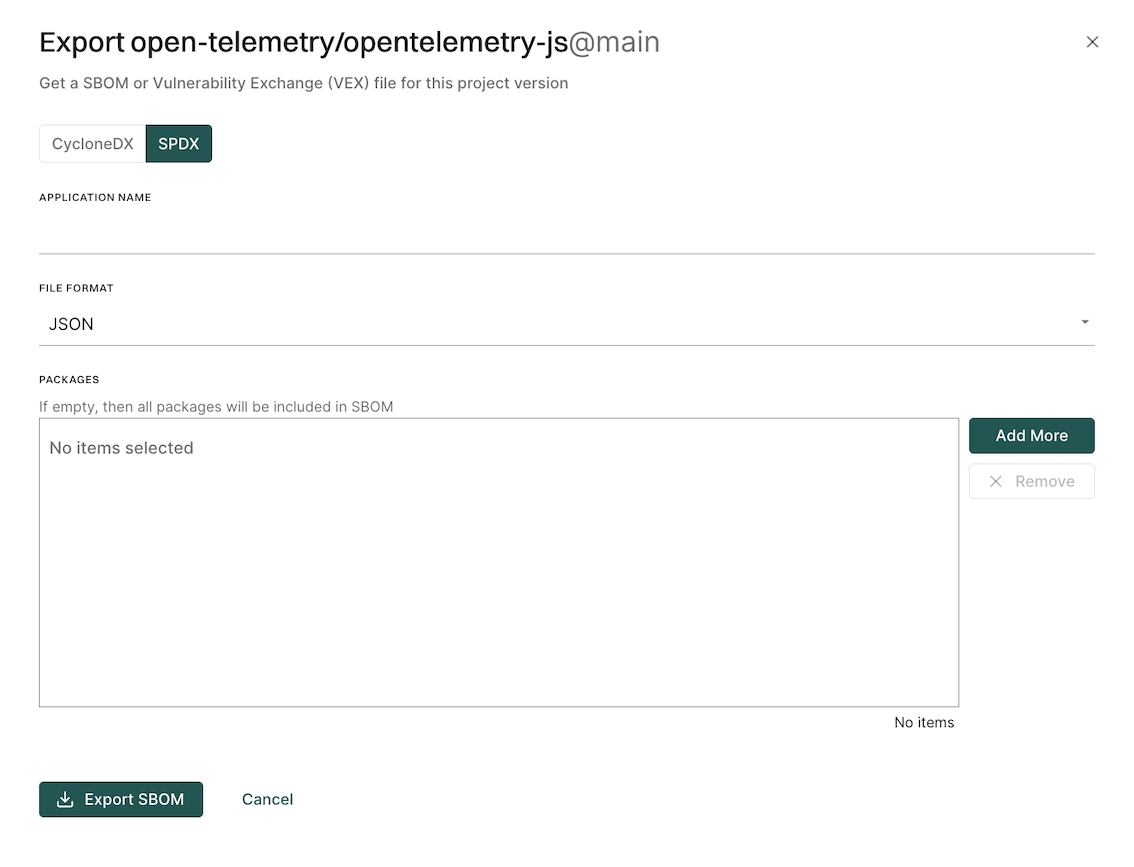
Select SPDX.
Enter the name of your application in Application Name.
Select the output format and type of SBOM you would like to generate in File Format.
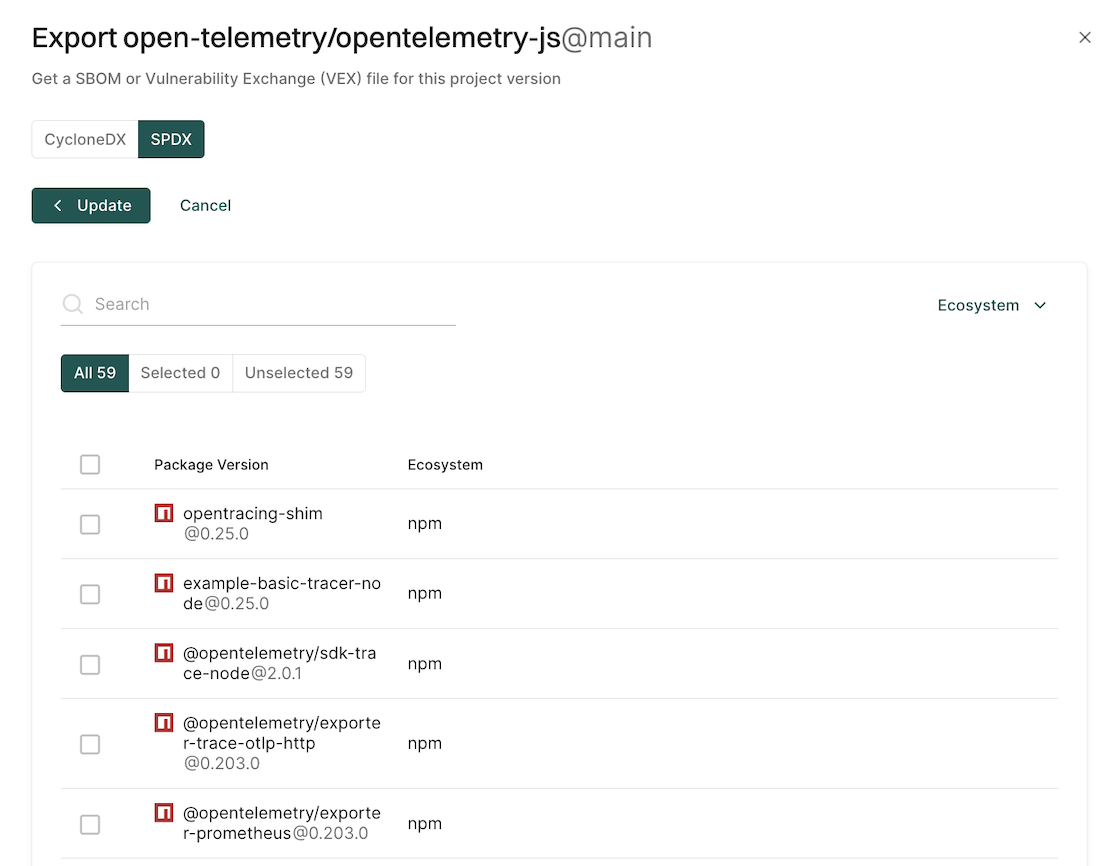
Click Add More to select the packages and package versions you want to include in the SBOM.
If you do not select specific packages, the SBOM will include information for all packages and package versions.
You can filter by ecosystem to select the type of packages to include in the SBOM.
You can also search and select multiple package versions of the same package.
Click Export SBOM.
A file containing the SBOM will download from your browser.
Export SBOM through endorctl
You can use the following options with the SBOM export command.
Flag
Environment Variable
Type
Description
component-type
ENDOR_SBOM_COMPONENT_TYPE
string
Set the SBOM component type to application, or library (default application).
output-format
ENDOR_SBOM_OUTPUT_FORMAT
string
Set the SBOM format to json or xml for CycloneDX, and json or tag-value for SPDX (json is the default for both).
package-version-name
ENDOR_SBOM_PACKAGE_VERSION_NAME
string
Name of the package version for which you want to generate an SBOM.
package-version-uuid
ENDOR_SBOM_PACKAGE_VERSION_UUID
string
The UUID of the package version for which you want to generate an SBOM.
timeout
ENDOR_SBOM_TIMEOUT
string
Set the timeout for the SBOM generation (default 30s). Use the Go duration format, for example, 30s, 1m.
with-vex
ENDOR_SBOM_WITH_VEX
boolean
Generate the corresponding VEX document along with the SBOM.
project-uuid
ENDOR_SBOM_PROJECT_UUID
string
The UUID of the project for which you want to generate an SBOM.
project-name
ENDOR_SBOM_PROJECT_NAME
string
Name of the project for which you want to generate an SBOM.
app-name
ENDOR_SBOM_APP_NAME
string
Name of the application or the library. Required for multi-package SBOM export.
package-version-uuids
ENDOR_SBOM_PACKAGE_VERSION_UUIDS
string
The list of package version UUIDs to export an SBOM.
You can export an SBOM in CycloneDX or SPDX format using endorctl, for a single package version or across multiple package versions.
To export an SBOM you will need the package version name for which you’d like to create an SBOM or its UUID. You can also export an SBOM with multiple package versions. To export an SBOM with multiple package versions, you need the package version UUIDs or the project name.
Pass the package name or UUID to the command endorctl sbom export using the --package-version-name or --uuid flags.
To export an SBOM, you must first retrieve the package version name through the API.
You can easily export a reference package name and the scanned version you’d like to export as environment variables.
To export multiple package versions in an SBOM, you need the UUIDs of package versions, or the name or UUID of the project to which the package versions belong.
To create an SBOM based on project details, either provide the project UUID with the --project-uuid flag or the project name with the --project-name flag. You also need to provide a name for the package with the --app-name flag.
Run the command to create an SBOM with multiple package versions using the project UUID.
endorctl sbom export -n test --project-name=actions-hu/app-java-demo --app-name=actions-hu/app-java-demo >> cyclonedx-sbom.json
Generate an SBOM based on package version UUIDs, provide the package version UUIDs with the --package-version-uuids flag. You also need to provide a name for the package with the --app-name flag.
endorctl sbom export -n <Namespace> --package-version-uuids=<Package Version UUID 1>,<Package Version UUID 2>,... <Package Version UUID N> --app-name=<Application Name> >> <SBOM Name>.json
For example:
endorctl sbom export -n test --package-version-uuids=66e345c340669666c22979d6,89f456c340669666c229854a,43a56b1340669666c289d4a2 --app-name=actions-hu/app-java-demo >> spdx-sbom.json
To export multiple package versions in an SBOM, you need the UUIDs of package versions, or the name or UUID of the project to which the package versions belong.
To create an SBOM based on project details, either provide the project UUID with the --project-uuid flag or the project name with the --project-name flag. You also need to provide a name for the package with the --app-name flag.
Run the command to create an SBOM with multiple package versions using the project UUID.
Generate an SBOM based on package version UUIDs, provide the package version UUIDs with the --package-version-uuids flag. You also need to provide a name for the package with the --app-name flag.
endorctl sbom export --format spdx --output-format=json -n <Namespace> --package-version-uuids=<Package Version UUID 1>,<Package Version UUID 2>,... <Package Version UUID N> --app-name=<Application Name> >> <SBOM Name>.json
The upstream component version that is the base for the patch. The patched component in the SBOM is derived from this ancestor.
components[].pedigree.patches
false
List of patches applied to the component. Each patch includes the base64-encoded diff and the vulnerabilities it resolves.
components[].pedigree.patches[].diff
false
The base64-encoded patch content.
components[].pedigree.patches[].resolves
false
List of vulnerabilities resolved by this patch.
dependencies
false
Describes the relationships between components.
dependencies[].ref
false
Reference to a component in the dependency relationship.
dependencies[].dependsOn
false
List of components that this component depends on.
Patch data in SBOM
CycloneDX SBOMs generated by Endor Labs include patch data for components that use an Endor patch. This allows consumers of the SBOM to see exactly which upstream version was patched, what changes were applied, and which vulnerabilities those patches resolve.
The following fields describe how patch data appears in the exported SBOM.
Field
Description
pedigree.patches[].diff
Contains the patch data associated with the component. The diff object stores the patch as base64 encoded content with contentType set to text/plain.
pedigree.ancestors
Contains the upstream component version that was used as the base for the patch. This is the original version from which the patched version was derived.
pedigree.patches[].resolves
Identifies the vulnerabilities resolved by the patch. Each entry sets type to security and specifies name as the vulnerability identifier such as a GHSA ID.
version
Specifies the component version as declared in the manifest file. If a version reference such as endor-latest is used, the SBOM retains the value declared in the manifest file.
The following example shows a patched component in a CycloneDX SBOM.
The following table lists the mandatory and some optional fields in the VEX file that Endor Labs exports.
Field
Mandatory
Description
bomFormat
true
Specifies the format of the VEX document.
specVersion
true
The version of the specification used.
serialNumber
true
A unique identifier for the VEX document.
version
true
The revision number of the VEX document.
metadata
true
Contains metadata about the VEX document and primary component.
metadata.timestamp
true
The date and time when the VEX document was generated.
metadata.tools
true
Information about tools used to generate the VEX document.
metadata.tools.services
true
List of services used in generating the VEX document.
metadata.tools.services[].provider
true
Information about the provider of the service.
metadata.tools.services[].provider.name
true
The name of the service provider.
metadata.tools.services[].provider.url
true
URLs associated with the service provider.
metadata.tools.services[].name
true
The name of the service.
metadata.tools.services[].version
true
The version of the service.
metadata.tools.services[].description
true
A description of the service.
metadata.component
true
Information about the main component described by the VEX document.
metadata.component.bom-ref
true
A reference identifier for the component within the VEX.
metadata.component.type
true
The type of the main component.
metadata.component.name
true
The name of the main component.
metadata.component.version
true
The version of the main component.
metadata.component.hashes
true
Cryptographic hashes of the main component.
metadata.component.purl
true
The Package URL (purl) for the main component.
vulnerabilities
true
List of vulnerabilities associated with the component.
vulnerabilities[].id
false
The identifier of the vulnerability.
vulnerabilities[].references
false
References related to the vulnerability.
vulnerabilities[].references[].source.url
false
URL of the reference source.
vulnerabilities[].ratings
false
Severity ratings for the vulnerability.
vulnerabilities[].ratings[].score
false
Numerical score of the severity.
vulnerabilities[].ratings[].severity
false
Textual representation of the severity.
vulnerabilities[].ratings[].method
false
The method used for rating (for example, “CVSSv3”).
vulnerabilities[].ratings[].vector
false
The vector string for the rating.
vulnerabilities[].cwes
false
Common Weakness Enumeration (CWE) identifiers.
vulnerabilities[].description
false
A description of the vulnerability.
vulnerabilities[].detail
false
Detailed information about the vulnerability.
vulnerabilities[].recommendation
false
Recommended actions to address the vulnerability.
vulnerabilities[].advisories
false
List of advisories related to the vulnerability.
vulnerabilities[].advisories[].url
false
URL of the advisory.
vulnerabilities[].published
false
The date when the vulnerability was published.
vulnerabilities[].updated
false
The date when the vulnerability information was last updated.
vulnerabilities[].credits
false
Credits for individuals or organizations related to the vulnerability.
vulnerabilities[].credits.individuals
false
List of individuals credited.
vulnerabilities[].analysis
false
Analysis of the vulnerability’s impact on the component.
vulnerabilities[].analysis.state
false
The state of the analysis (for example, not_affected).
vulnerabilities[].analysis.justification
false
Justification for the analysis state.
vulnerabilities[].affects
false
Information about which components are affected by the vulnerability.
vulnerabilities[].affects[].ref
false
Reference to the affected component.
SPDX Format
The following table lists the mandatory and some optional fields in the SPDX file that Endor Labs exports.
Field
Mandatory
Description
spdxVersion
true
Specifies the SPDX specification version used.
dataLicense
true
Specifies the data license for the SPDX document.
SPDXID
true
Unique identifier for the SPDX document.
name
true
Name of the SPDX document.
documentNamespace
false
Defines the namespace URI for the document.
creationInfo
true
Contains metadata about when and how the document was created.
creationInfo.licenseListVersion
false
Specifies the version of the SPDX license list used.
creationInfo.creators[]
true
List of entities that created the document (tool, organization, or person).
creationInfo.created
true
The date and time when the document was created.
packages[]
true
List of packages included in the SPDX document.
packages[].name
true
Name of the package.
packages[].SPDXID
true
Unique identifier for the package.
packages[].versionInfo
false
Version of the package, if known.
packages[].supplier
false
Information about the package supplier.
packages[].downloadLocation
true
Location from where the package can be downloaded.
packages[].filesAnalyzed
false
Indicates whether the files in the package were analyzed.
packages[].licenseConcluded
false
License the package is concluded to be under.
packages[].licenseDeclared
false
License declared by the package supplier.
packages[].copyrightText
false
Copyright statement for the package.
packages[].externalRefs[]
false
List of external references related to the package.
packages[].externalRefs[].referenceCategory
true
Category of the external reference.
packages[].externalRefs[].referenceType
false
Type of external reference (for example, purl).
packages[].externalRefs[].referenceLocator
true
Value used to locate the reference (for example, a Package URL).
Import SBOMs
Software consumers, or those who use software, need to understand their software inventory holistically. This includes both the software that they create and the software that they purchase. For the software that a software consumer procures, they can request an SBOM to get visibility into the software composition of what they deploy in their environment.
If an information security analyst on your team sends a mass email to all your vendors asking them to provide SBOMs, you are likely to get some combination of confused replies, refusals to hand over anything, and a few incredibly detailed json and XML files. An inbox full of attachments is not the correct way to manage information. Storing these SBOMs in platforms like Google Drive, Dropbox, or any other information repository without active utilization will yield minimal benefits.
Endor Labs’ SBOM hub ingests, parses, analyzes, and tracks your vendor’s SBOMs and offers a structured method to track and version control every SBOM.
SBOM Hub
SBOM Hub is a central location for software consumers to store, search, and monitor their SBOMs. If you are building out an SBOM program you should visit our blog on Key questions for your SBOM program to learn more about SBOM best practices and program management.
You can use Endor Labs finding policies to identify vulnerabilities, unmaintained open source software, license risk and outdated dependencies in the SBOMs provided to you by your third-party software vendors.
Import an SBOM to Endor Labs
Once you have an SBOM from one of your third-party vendors, you should import the SBOM into Endor Labs to monitor and manage it.
Import SBOMs through the Endor Labs UI
Import your project’s SBOM into the Endor Labs application to discover vulnerabilities and view findings. You can either upload the file from the user interface or through endorctl.
Select SBOM Hub on the left sidebar.
Select Import SBOM in the top right-hand corner.
Choose Upload File and select the type of SBOM you would like to upload.
Use SPDX if your vendor has provided you with a SPDX format SBOM
Click Browse to upload your SBOM from your workstation or drag the SBOM into the Endor Labs UI.
Once you have imported your SBOM to Endor Labs, Endor Labs will schedule a scan in the background for the SBOM within the next few hours. To instantly scan the SBOM see Importing SBOMs through the Endor Labs CLI
Tip
Endor Labs supports CycloneDX or SPDX format SBOMs in XML or json format.
Import SBOMs through the Endor Labs CLI
To import an SBOM to Endor Labs with automation or using the CLI use the following command:
Delete SBOM - Select one or more SBOMs, click the vertical three dots on the right side, then click Delete SBOM.
Include Tags for an SBOM - Select one or more SBOMs and click Edit Tags on the top right-hand corner. Tags are labels or keywords that you can use to categorize SBOMs. They help classify and group related SBOMs, making it easier to search, filter, and manage the SBOMs. Tags can have a maximum of 63 characters and can contain letters A-Z, numbers (0-9), or any of (=@_.-) special characters.
Tagging strategies for SBOMs
To improve your team’s ability to search and manage SBOMs, you can tag them as they are received. Tagging SBOMs helps your team understand the applications, vendors, and their importance to your business.
Use Case
Rationale
Example Tags
Data Classification
Understand the kind of data a vendor or vendor application handles for you.
Some SBOMs may lack vendor information. Be sure to label your SBOMs with vendor names for better vendor management.
Vendor_RedHat
Vendor Criticality
Tag your SBOMs according to your internal vendor tier strategy or if the vendor is considered critical. This will streamline regular SBOM reviews.
Critical_Vendor, Tier1_Vendor
Notifications
Notifications are alerts generated when findings match the criteria defined in your action policies or remediation policies. They are sent to your configured notification integrations, such as email, Slack, Jira, webhooks, Vanta, or GitHub PR comments. The notifications view gives you centralized visibility across integrations, helps you debug and recover from delivery failures, and lets you track your security work queue through open and resolved states, and provides an audit trail of all notifications.
The notifications are organized into three categories:
Open: Notifications for findings that are still open and require attention.
Resolved: A notification is moved to resolved when the finding associated with it is either resolved or deleted.
All: All notifications in your namespace, regardless of their status.
You can view the following details for each notification:
Opened: Elapsed time since the notification was created.
Policy: Action policy or remediation policy that triggered the notification.
Project: The project associated with the notification.
Last Evaluated: The elapsed time since the action policy or remediation policy was last evaluated.
Violations: The number of policy violations that triggered this notification.
Namespace: The namespace where the notification is created.
Channels: The notification channels configured in your namespace where alerts are sent, such as Jira, Email, Slack, Vanta, Webhooks, and GitHub PR.
When a notification has an error, a red triangle appears next to it. Click the notification to view more details about the error.
Search notifications
You can search notifications by the policy name or Jira issue key.
Policy name: Enter the action policy or remediation policy name to find all notifications associated with that policy. For example, search for SAST to find all notifications triggered by the SAST action policy.
Jira issue key: Enter a Jira issue ID in the format PROJECT-KEY-NUMBER to find all notifications associated with that Jira issue. For example, searching for BUG-235 shows notifications that are linked to the Jira issue BUG-235.
Filter notifications
Use filters to refine notifications by time range, projects, notification channels, or error status. You can use the following filter options:
All Time: Filter notifications by creation date. You can select from the following options: Last Day, Last week, last month, last 60 days, last 90 days, All Time, or you can customize the time range.
Projects: Enter a project name in your namespace and select it. You can select multiple projects to view notifications from those projects.
Channels: Filter notifications by notification channels such as Slack, Jira, Email, webhooks, Vanta, and GitHub PR. The channels displayed depend on the notification integrations set up in your namespace.
Has Errors: Filter to show only notifications that have errors in their notification delivery. This includes errors such as failed delivery attempts, configuration issues, or unsupported scenarios.
View notification details
Each notification contains detailed information about the security event or policy violation that triggered it, including metadata about the associated project, the findings that caused the notification, and any actions that were taken in response. You can also view any errors that occurred during notification delivery.
To view notification details:
Select Notifications from the left sidebar.
Select a notification.
Select Overview to view key information about the notification such as its metadata, triggered actions, and associated findings.
Notification metadata: Project associated with the notification, the date and time when the notification was opened, the date and time when the policy was last evaluated, and the notification UUID.
Actions triggered by this notification: Lists all actions that were triggered by the notification, including issue IDs created in external systems, and links to external tickets or pull requests.
Findings that triggered this notification: The findings that matched the action policy or remediation policy criteria and caused this notification to be created.
Select Issues to view error messages and troubleshoot notification delivery problems.
Manage notifications
Use actions on each notification to view details, navigate to the related policy, or dismiss notifications.
To navigate to the policy which triggered a notification:
Select Notifications from the left sidebar.
Click the vertical three dots on the notification whose policy you want to view.
Select Go to Policy to view and update the policy.
Dismiss notification
Dismiss a notification to pause all further posting, processing, and updates associated with it. Endor Labs also stops sending updates to existing Jira tickets, emails, Slack messages, or webhooks, even if the underlying finding changes or gets resolved. You can still view dismissed notifications in the All category.
You can dismiss any notification from Open or Resolved.
To dismiss a notification:
Select Notifications from the left sidebar.
Click the vertical three dots on the notification you want to dismiss.
Select Dismiss Notification.
Undismiss notification
When you undismiss a notification that is in Open state, Endor Labs re-evaluates it in the next scan cycle or schedule based on the current state of the underlying finding and then processes it accordingly, for example, sending updates to Jira, email, Slack, or webhooks if the policy applies.
To undismiss a notification:
Select Notifications from the left sidebar.
Click the vertical three dots on the dismissed notification.
Select Undismiss Notification.
Notification integrations
You must configure notification integrations to receive notifications. These integrations define where notifications are sent when action policies or remediation policies trigger them. Endor Labs supports integrations like email, Jira, Slack, Vanta, and other tools.
Namespaces in Endor Labs define a way to group projects and create logical partitions in an organization based on organizational units, business units, project requirements, or teams.
Using namespaces, administrators can:
Define hierarchy and control access to project resources within a namespace.
Establish policy governance by defining the rules of engagement and setting different or same guardrails across namespaces.
Namespaces in an organization
In Endor Labs, you can partition each tenant into multiple namespaces and further divide each namespace into sub-namespaces called child namespaces. Each namespace has its own authorization rules and integrations.
Child namespaces inherit settings, policies, and features from their parent namespace but can also define their own authorization rules, policies, and configurations. This structure helps organizations model hierarchical environments, with each level managing its own access controls and operational settings.
When you access your tenant, Endor Labs includes data from all child namespaces in the dashboard by default, such as vulnerabilities, dependencies, packages, and more. In namespace, toggle the setting to All child namespaces excluded to exclude child namespaces and view data and metrics for only the selected namespace.
When you sign in to Endor Labs for the first time, create a tenant for your organization, such as abccorp.
Now you can create logical separations in the form of namespaces for different business units in your organization, such as Security Business Unit (security-bu), Datacenter Business Unit (datacenter-bu), and Orchestration Agent Business Unit (orchestration-agent-bu), inside your main tenant abccorp.
You can further partition the Security Business Unit into sub-namespaces, such as the Development team (dev-team), Finance Team (finance-team), and Testing Team (testing-team).
There can be several namespaces within abccorp. For example, the dev-team namespace that hosts projects belonging to the development team of the Security Business Unit and the test-team namespace that hosts projects belonging to the testing team of the Security Business Unit.
Use namespaces for authorization
Large enterprises with multiple business units, teams, or groups can assign different namespaces to different groups and apply authorization policies that restrict access to specific groups. This ensures least privilege access to critical information is available in the organization.
Organizations can also provision namespaces to provide read access to security teams in specific namespaces while they provide write access to AppSec teams for managing policies.
Create an authorization policy giving users in the development team of the security business unit permissions to scan their projects. Users from group @developers.abccorp.ai can have code scanner permissions for the namespace dev-team.
Users from group @applicationsecurity.abccorp.ai can have policy editor permissions for the namespace dev-team. The developers can scan the code, and the application security professionals can define the policies for code compliance.
The application security professionals can also choose to define the policies at the tenant level abccorp and choose to apply the same policies to all the child namespaces. This way, they won’t need to create policies individually for every child namespace. The development team inherits the policies from the organization and won’t be able to modify them. They can, however, add additional policies that are specific to engineering to their namespace dev-team and define specific rules and conditions applicable only to them.
Use namespaces for policy governance
Administrators can use namespaces effectively for policy governance and make sure that teams in their organization adhere to industry-wide policy standards enforcing compliance.
Let us assume that the application security team in ABCcorp wants to define organization-wide rules for code compliance, vulnerability management, and secret detection. They also need Jira tickets filed for all cases.
The application security engineers can create the following objects at the ABCcorp tenant level and propagate these objects to all the namespaces under abccorp so that it applies to the entire organization.
Define action policy to break the build when critical vulnerabilities are detected.
Define action policy to warn the user of detected code compliance misconfigurations.
Define action policy to break the build when valid secret tokens are detected in their code.
Create Jira tickets and notify the appropriate team to take remediation measures.
Create a namespace
To create a namespace in your tenant:
Sign in to Endor Labs.
Select Settings > Namespaces from the left sidebar.
Click New Namespace.
Enter a title and description for the namespace.
The title can have a maximum of 32 characters and must contain only lowercase letters (a-z), numbers (0-9), and characters (_-).
Enter tags that you want to associate with this namespace.
Tags can have a maximum of 255 characters and must contain letters (A-Z), numbers (0-9), and characters (=@_.-).
Edit a namespace
You can choose to modify the description of a namespace or include tags for it. You can’t modify its title once a namespace is created. To edit details of a namespace in your tenant:
Select Settings > Namespaces from the left sidebar.
Choose the namespace and click Edit.
Edit the description or include tags for the namespace.
Click Update Namespace.
Delete a namespace
Deleting a namespace permanently deletes all its child namespaces and its projects. To delete a namespace:
Select Settings > Namespaces from the left sidebar.
Choose the namespace and click Delete.
Select and confirm the deletion.
Click Delete Namespace.
Data propagation from parent to child namespaces
Data propagation defines how the data is inherited by the child namespace from its parent namespace.
Finding Policies - When a new namespace is created, all the finding policies in the parent are inherited by the child namespaces. Any new finding policy you create in the parent, you can choose to apply it to the child namespaces by selecting Propagate this policy to all child namespaces.
Action Policies - When a new namespace is created, all the action policies in the parent are inherited by the child namespaces. Any new action policy you create in the parent, you can choose to apply it to the child namespaces by selecting Propagate this policy to all child namespaces.
Remediation Policies - When a new namespace is created, all the remediation policies in the parent are inherited by the child namespaces. Any new remediation policy you create in the parent, you can choose to apply it to the child namespaces by selecting Propagate this policy to all child namespaces.
Exception Policies - When a new namespace is created, all the exception policies in the parent are inherited by the child namespaces. Any new exception policy you create in the parent, you can choose to apply it to the child namespaces by selecting Propagate this policy to all child namespaces.
Package Manager Integrations - Package manager integrations of the parent are not inherited by the child namespaces. Any new package manager integration you create in the parent, you can choose to apply them to the child namespaces by selecting Propagate this package manager to all child namespaces.
Integrations - Integrations in the parent are not inherited by the child namespaces.
Authorization Policies - Authorization policies of the parent are inherited by all its child namespaces. You can choose to group the authorization policies of the child namespaces in their parent namespace and manage them easily.
Secret Rules - You can choose to apply custom secret rules created in the parent to its child namespaces by selecting Propagate this rule to all child namespaces.
API Key - You can create an API key in a namespace and select Propagate this rule to all child namespaces to apply the key to all child namespaces.
Tenant and namespace terminologies
Tenant is the top-level entity under which you can create namespaces and child namespaces.
To denote a namespace, always use its fully qualified name. Fully qualified name for a namespace is in the format tenantname.namespacename, and child namespace is in the format tenantname.namespacename.childnamespacename.
In this example, the tenant is abccorp and its child namespaces are abccorp.security-bu, abccorp.datacenter-bu, and abccorp.agent-bu. The child namespaces of abccorp.security-bu are abccorp.security-bu.dev-team, abccorp.security-bu.testing-team, and abccorp.security-bu.finance-team.
Consider a tenant named acme with a child namespace dev, which in turn has a child namespace app. The fully qualified namespace for app is acme.dev.app.